Solutions to Tutorial 3 - Data
Question A
Categorise the following data types into Nominal, Ordinal, Interval or Ratio data:
SOLUTION:
- Floor area - RATIO
- Memory card capacity - RATIO
- Premier league positions - ORDINAL
- Shapes - NOMINAL
- Latitude - INTERVAL
- Pay grades - ORDINAL
- Salary - RATIO
- Playing cards - NOMINAL
- Longitude - ORDINAL (it’s very nearly INTERVAL, however longitude loops back around)
- Olympic medals (gold, silver, bronze) - ORDINAL
- Vegetables - NOMINAL
- Date - INTERVAL
- Foot size - ORDINAL
- Musical notes - (NOMINAL if considering their names, ORDINAL if considering their octaves too, may also be INTERVAL when considered musically. Only RATIO if considering wavelengths, but these increase exponentially.)
- Horsepower - RATIO
Question B
-
Give an example of a data set with 6 values that has the same mean, median, and mode.
SOLUTION: e.g. \(\{3, 3, 3, 3, 3, 3\}\). Mean is 3, median is 3, and mode is 3.
-
Give an example of a data set with 5 values that has different values of mean, median, and mode.
SOLUTION: e.g. \(\{1, 1, 2, 3, 493\}\). Mean is 100, median 2, mode is 1.
Question C
For each of the following determine the most appropriate data visualisation and draw it:
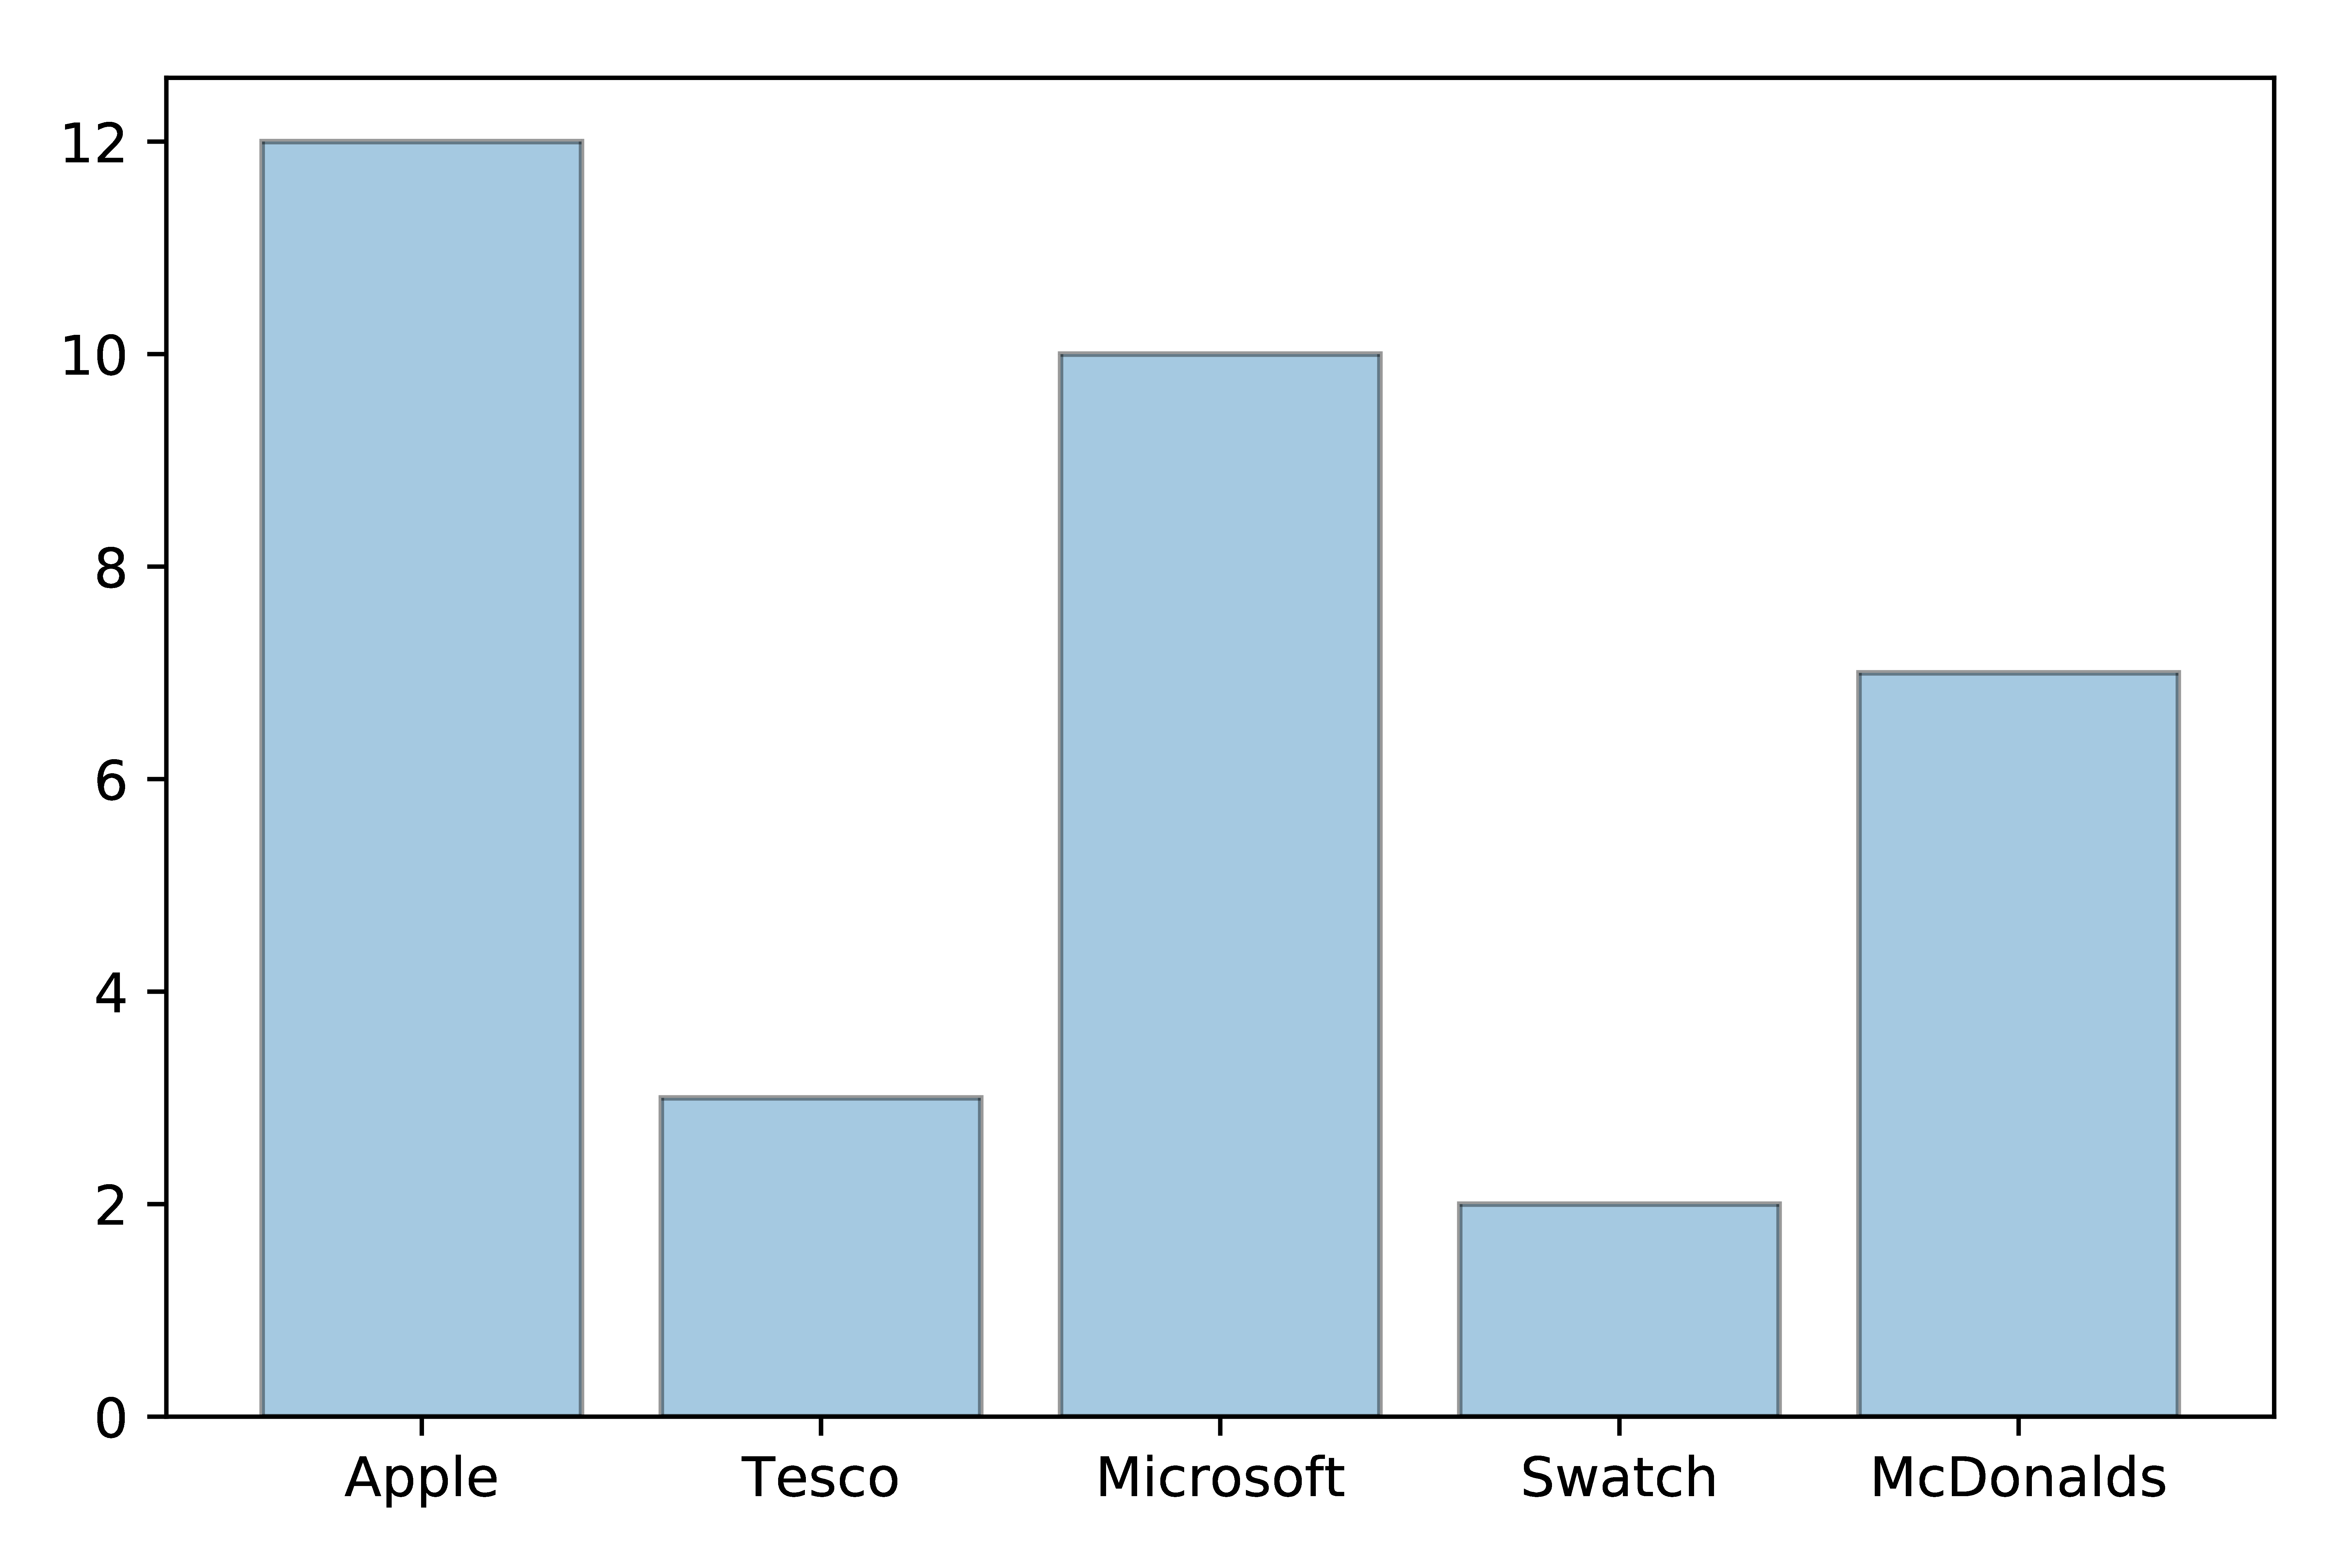
| Company | End of Year Profit |
|---|---|
| Apple | $12 million |
| Tesco | $3 million |
| Microsoft | $10 million |
| Swatch | $2 million |
| McDonalds | $7 million |
SOLUTION:
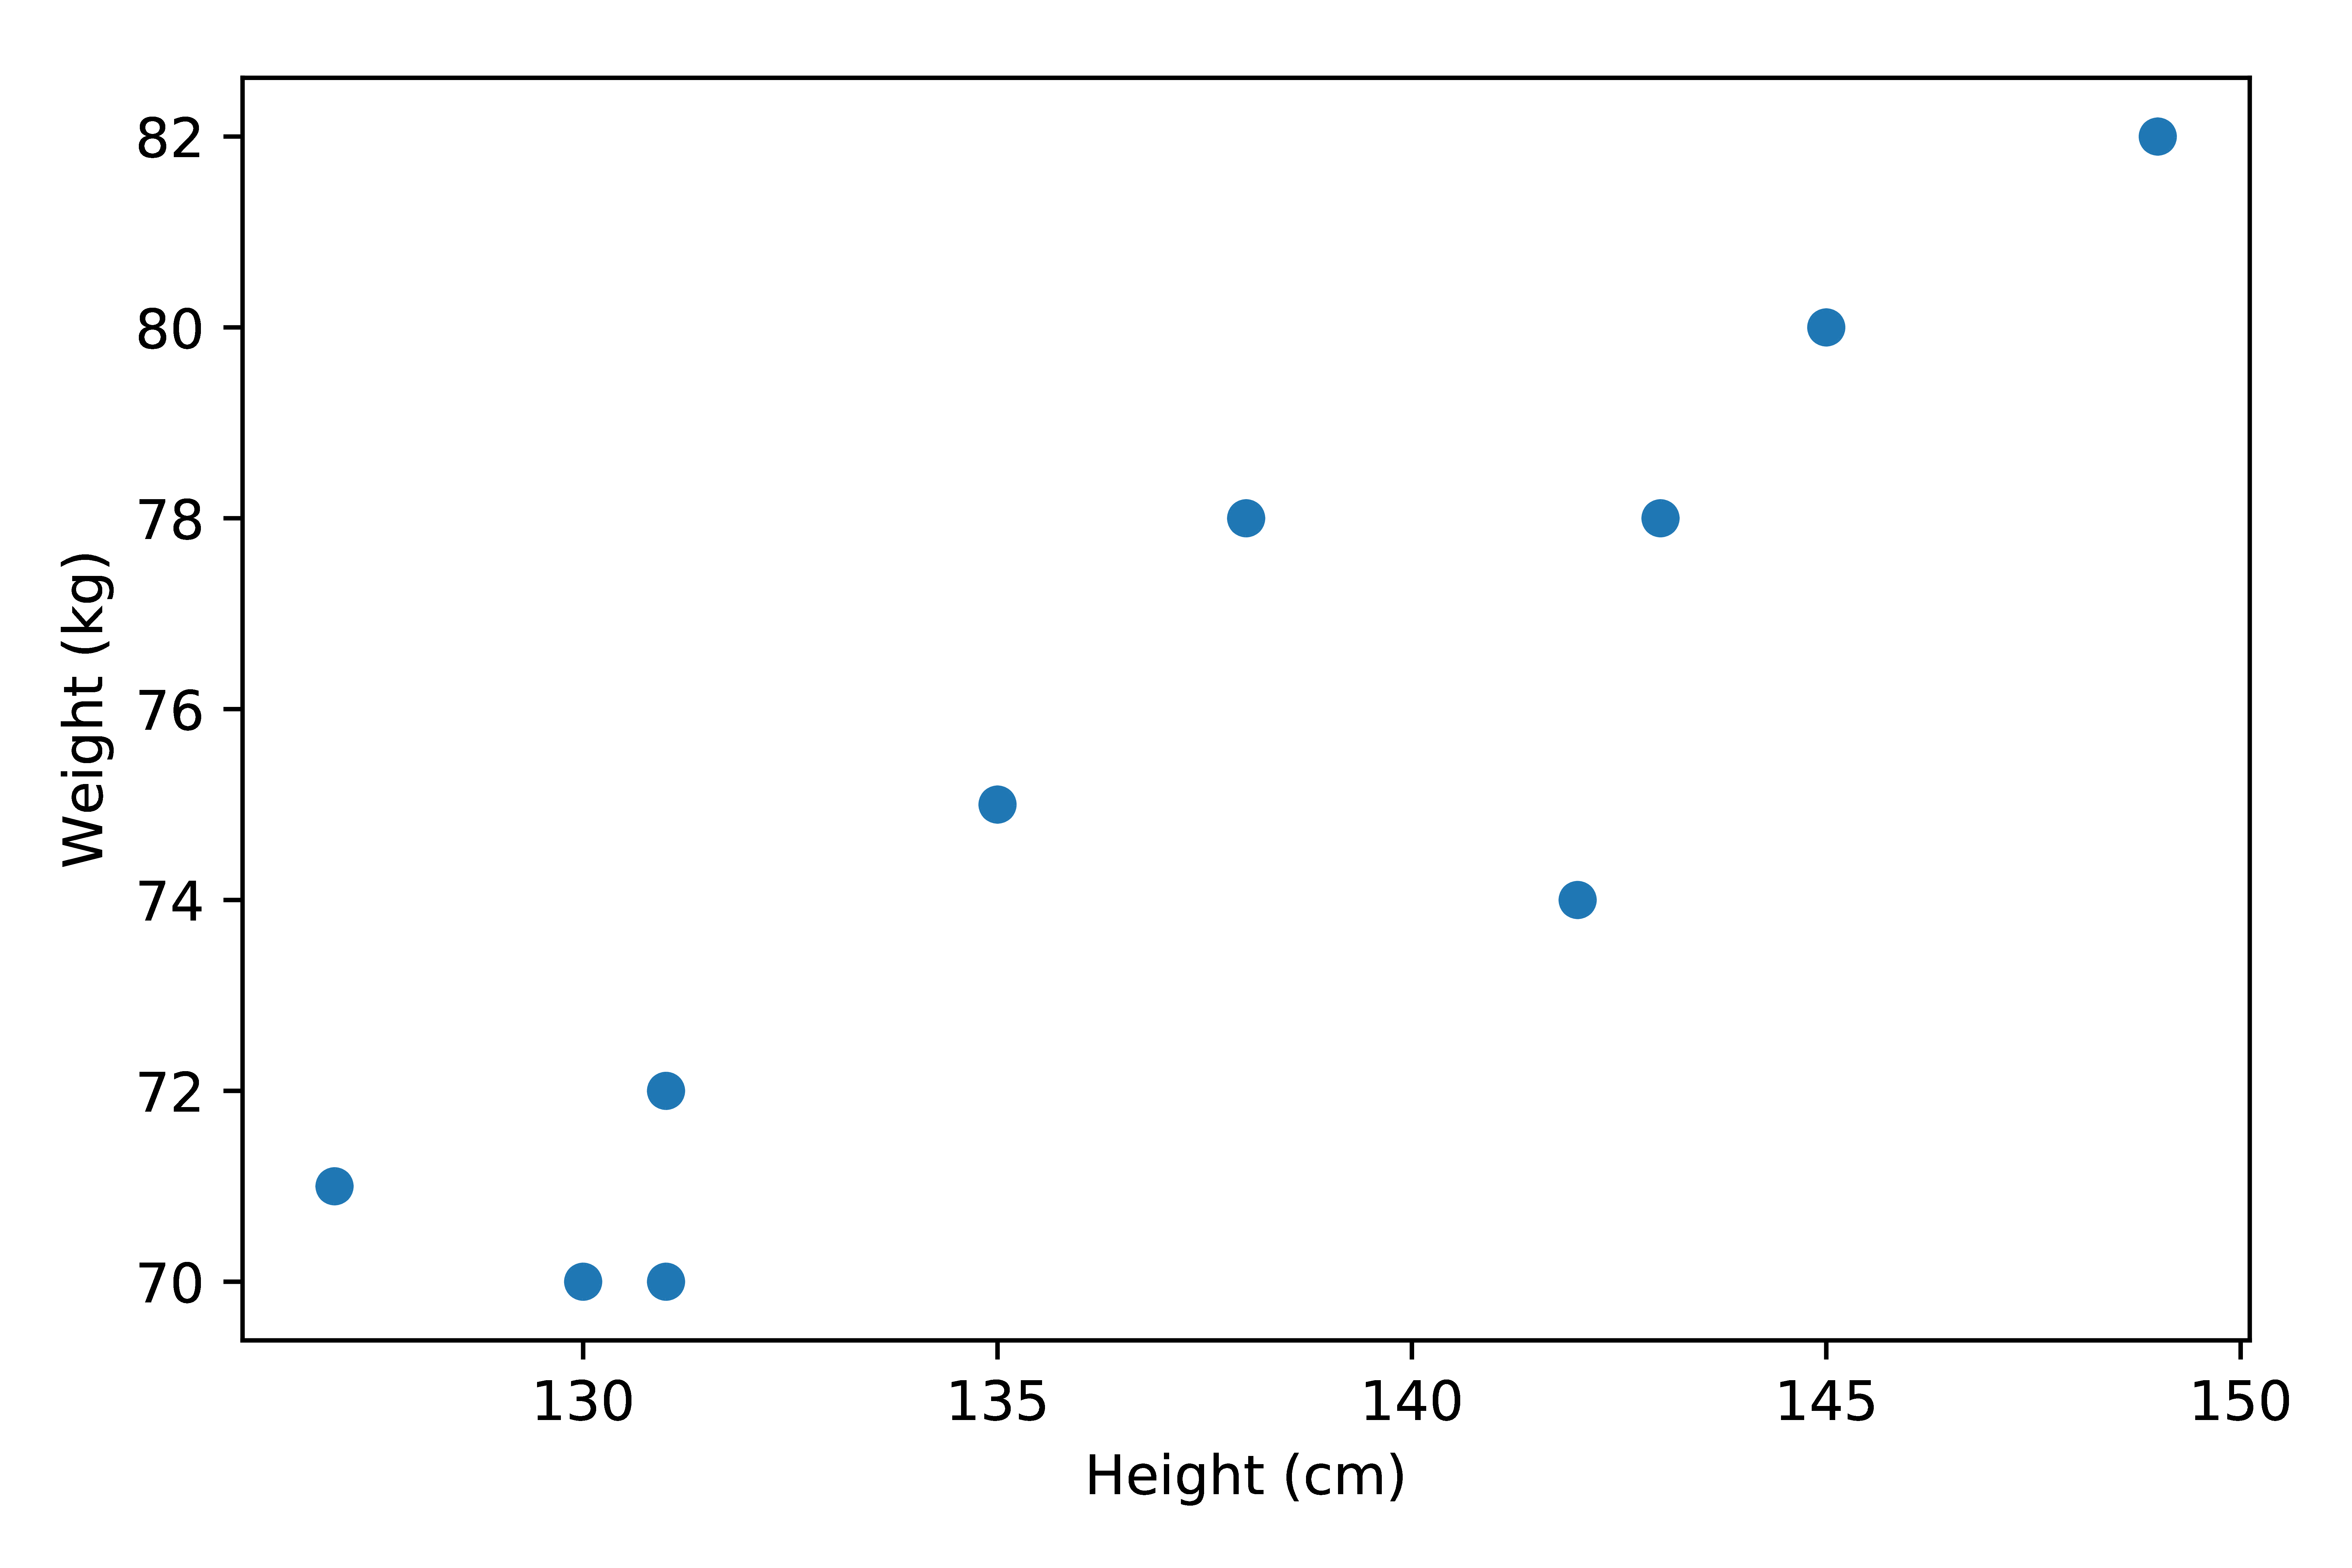
| Height (cm) | 131 | 142 | 130 | 127 | 138 | 149 | 131 | 135 | 143 | 145 |
|---|---|---|---|---|---|---|---|---|---|---|
| Weight (kg) | 70 | 74 | 70 | 71 | 78 | 82 | 72 | 75 | 78 | 80 |
SOLUTION:
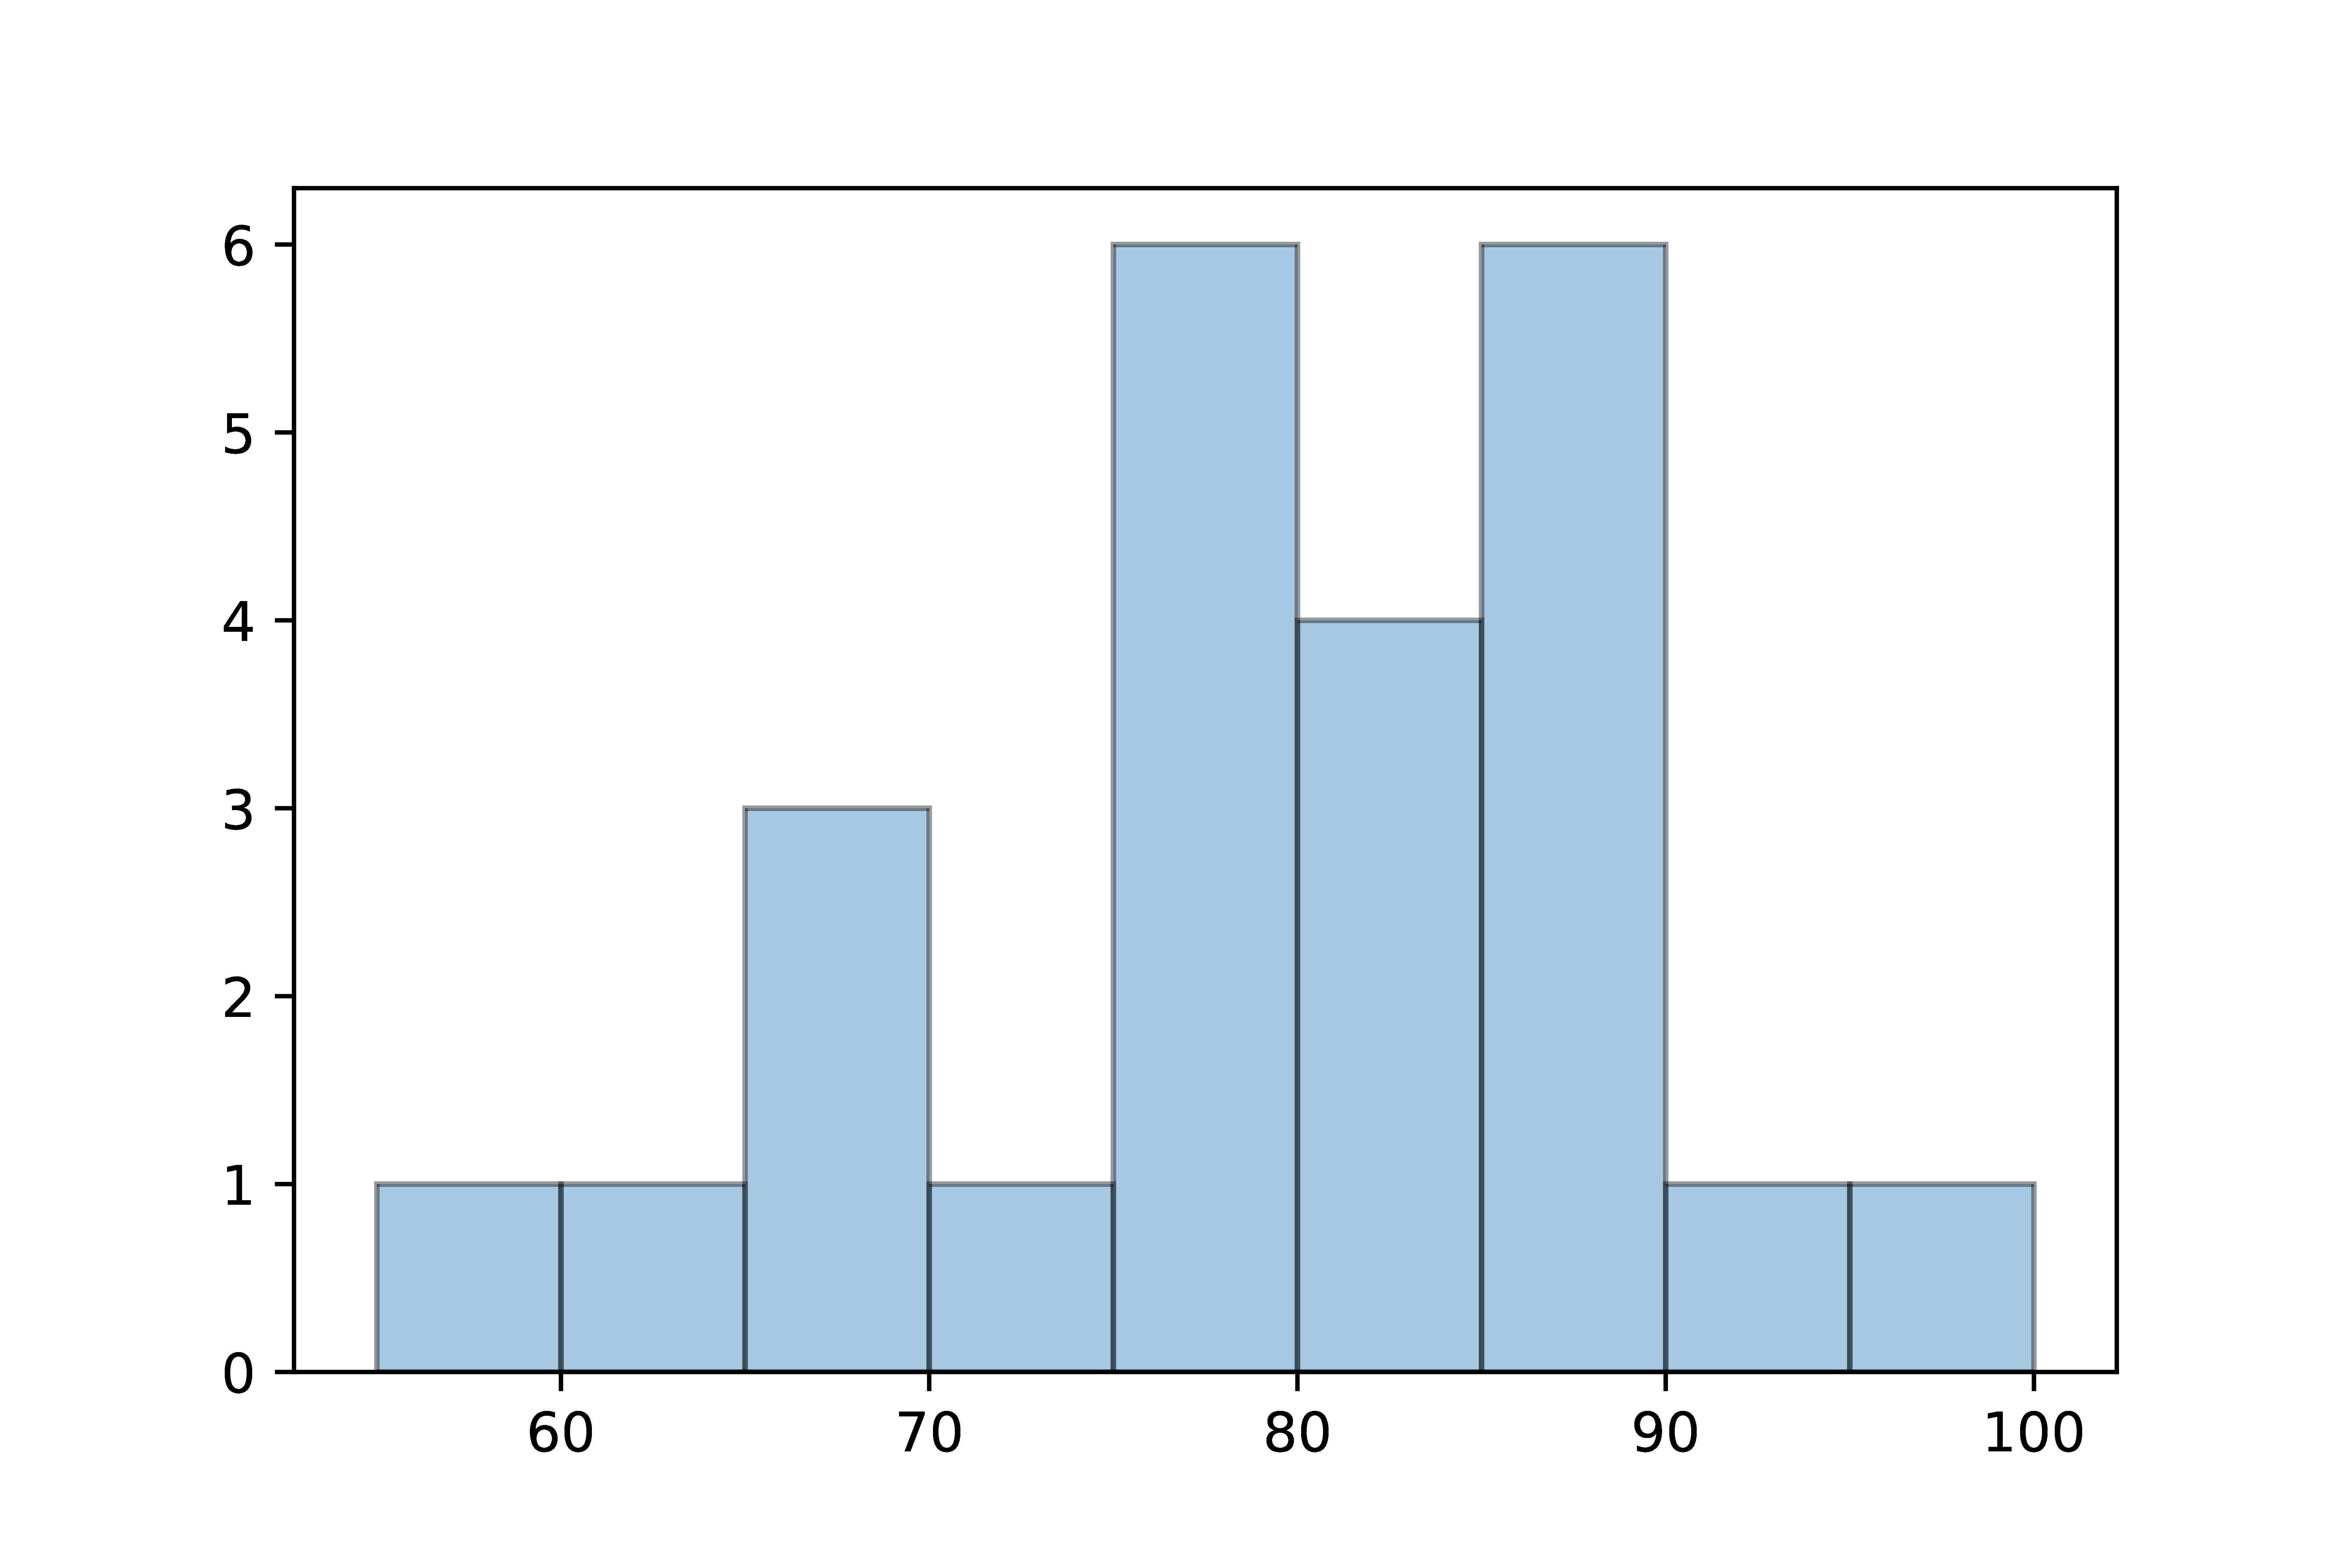
Ages of patients in a ward: {57, 64, 69, 69, 69, 74, 75, 76, 76, 77, 78, 79, 80, 81, 81, 84, 86, 87, 87, 88, 89, 89, 92, 98}
SOLUTION:
Question D
Look at the data visualisation below:
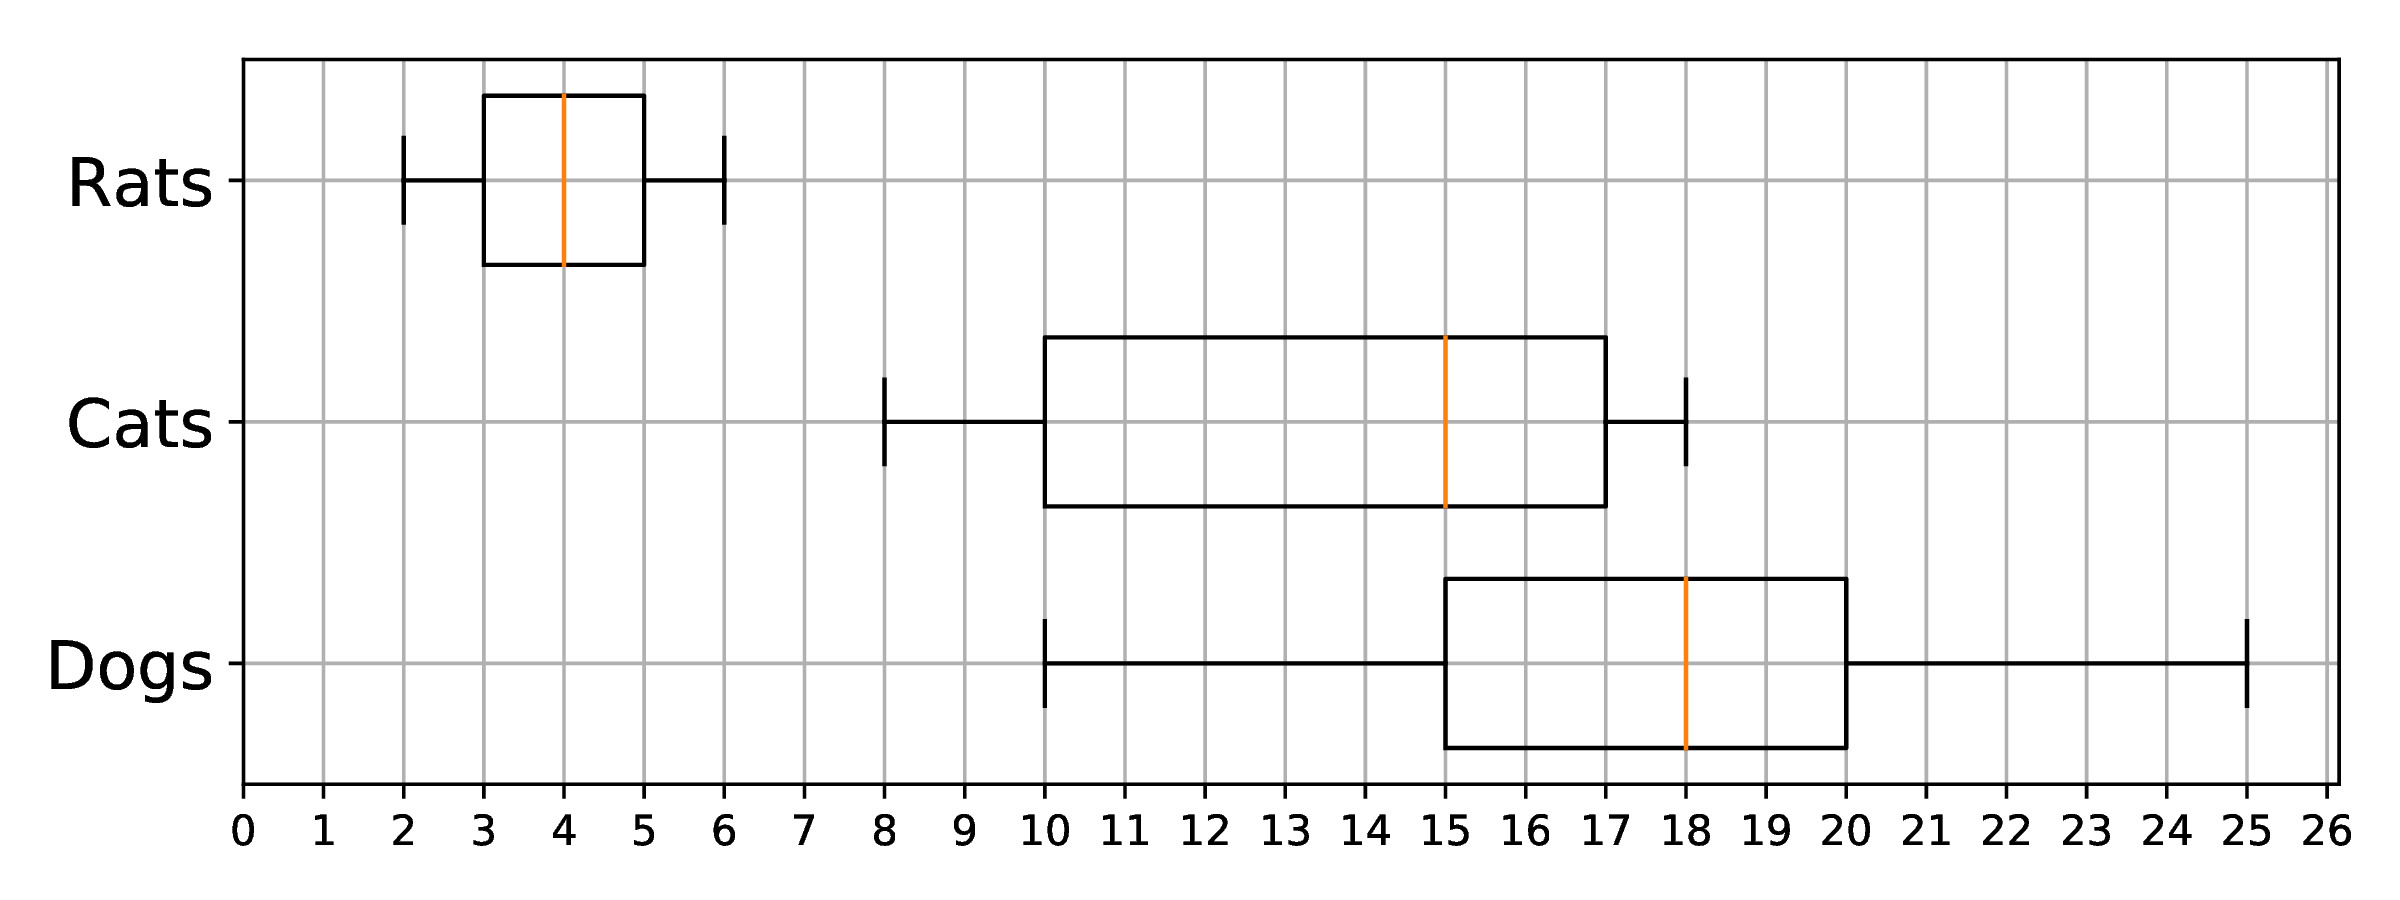
-
Give the range, median, Q1, Q3, and IQR for the weigths of dogs, cats and rats.
SOLUTION:
- Dogs:
- Range = 15
- Q1 = 15
- Median = 18
- Q3 = 20
- IQR = 5
- Cats:
- Range = 10
- Q1 = 10
- Median = 15
- Q3 = 17
- IQR = 7
- Rats:
- Range = 4
- Q1 = 3
- Median = 4
- Q3 = 5
- IQR = 2
- Dogs:
-
Can we select a dog that is heavier than a cat?
SOLUTION: Yes
-
Can we select a cat that is heavier than a dog?
SOLUTION: Yes
-
Can we select a rat that is heavier than a dog?
SOLUTION: No
-
Can we select a cat that is lighter than a rat?
SOLUTION: No
-
A dog is selected at random, what is the probability that there exists a cat heavier than it?
SOLUTION: 0.5. As 50% of all dogs are heavier than any can (median dog is equal to maximum cat), then there is a probability 0.5 of selecting a dog heavier than the heaviest cat, and a probability 0.5 of selecting a dog which is lighter than the heaviest cat.
-
Look at the data visualisation below:
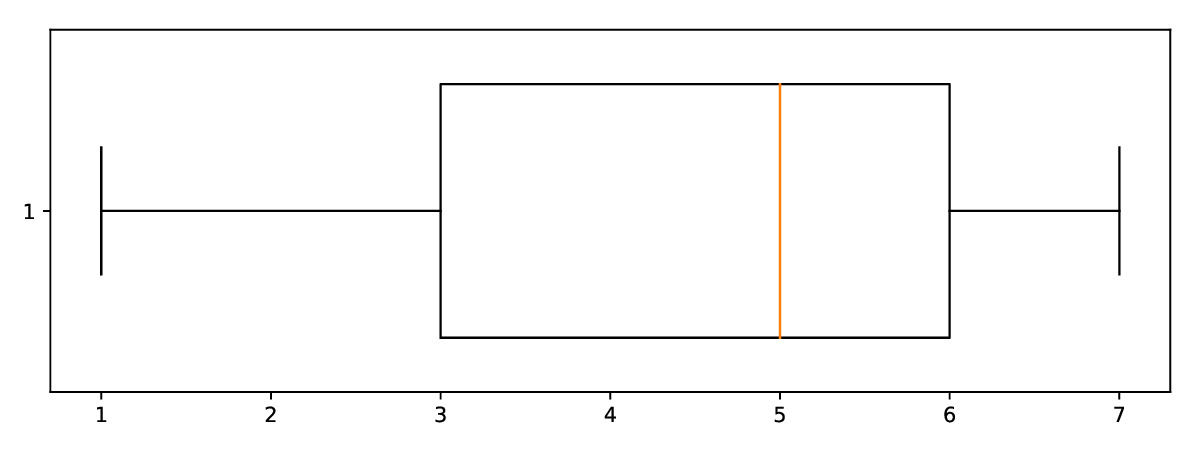
Give a data set with 11 values that would correspond to this.
SOLUTION: For example \(\{1, 1, 3, 4, 5, 5, 5, 5, 6, 7, 7\}\), any set of values where the 1st value is 1, the 3rd is 3, the 6th is 5, the 9th is 6, and the 11th is 7.
Question E
In one day, the total amount of money spent at 2 shops by customers are shown below:
- Shop 1: {£3.00, £2.50, £7.80, £10.11, £0.99, £1.20, £3.00, £2.99, £2.40, £0.50, £5.00, £3.35, £2.40, £2.40, £5.10, £1.20, £3.00, £3.00}
- Shop 2: {£50.10, £48.30, £41.99, £50.30, £61.00, £48.20, £51.50, £39.00, £60.00, £42.12, £39.00, £55.00, £59.99, £47.80, £39.00}
-
Calculate the mean and median of each data set.
SOLUTION:
- Mean of Shop 1: £3.33
- Median of Shop 1: £2.995
- Mean of Shop 2: £48.88667
- Median of Shop 2: £48.3
-
Calculate the variance and standard deviations of each data set.
SOLUTION:
- Variance of Shop 1: £5.4591
- Standard deviation of Shop 1: £2.3365
- Variance of Shop 2: £ 55.3188
- Standard deviation of Shop 2: £7.4377
-
Which data set has the largest relative variance?
SOLUTION:
- Coefficient of variance for Shop 1: £2.3365 / £3.33 = 0.701646
- Coefficient of variance for Shop 2: £7.4377 / £48.88667 = 0.152141
- Therefore Shop 1 has the largest relative variance.
-
Draw box and whisker plots for both data sets on different axes and comment on their shape.
SOLUTION:
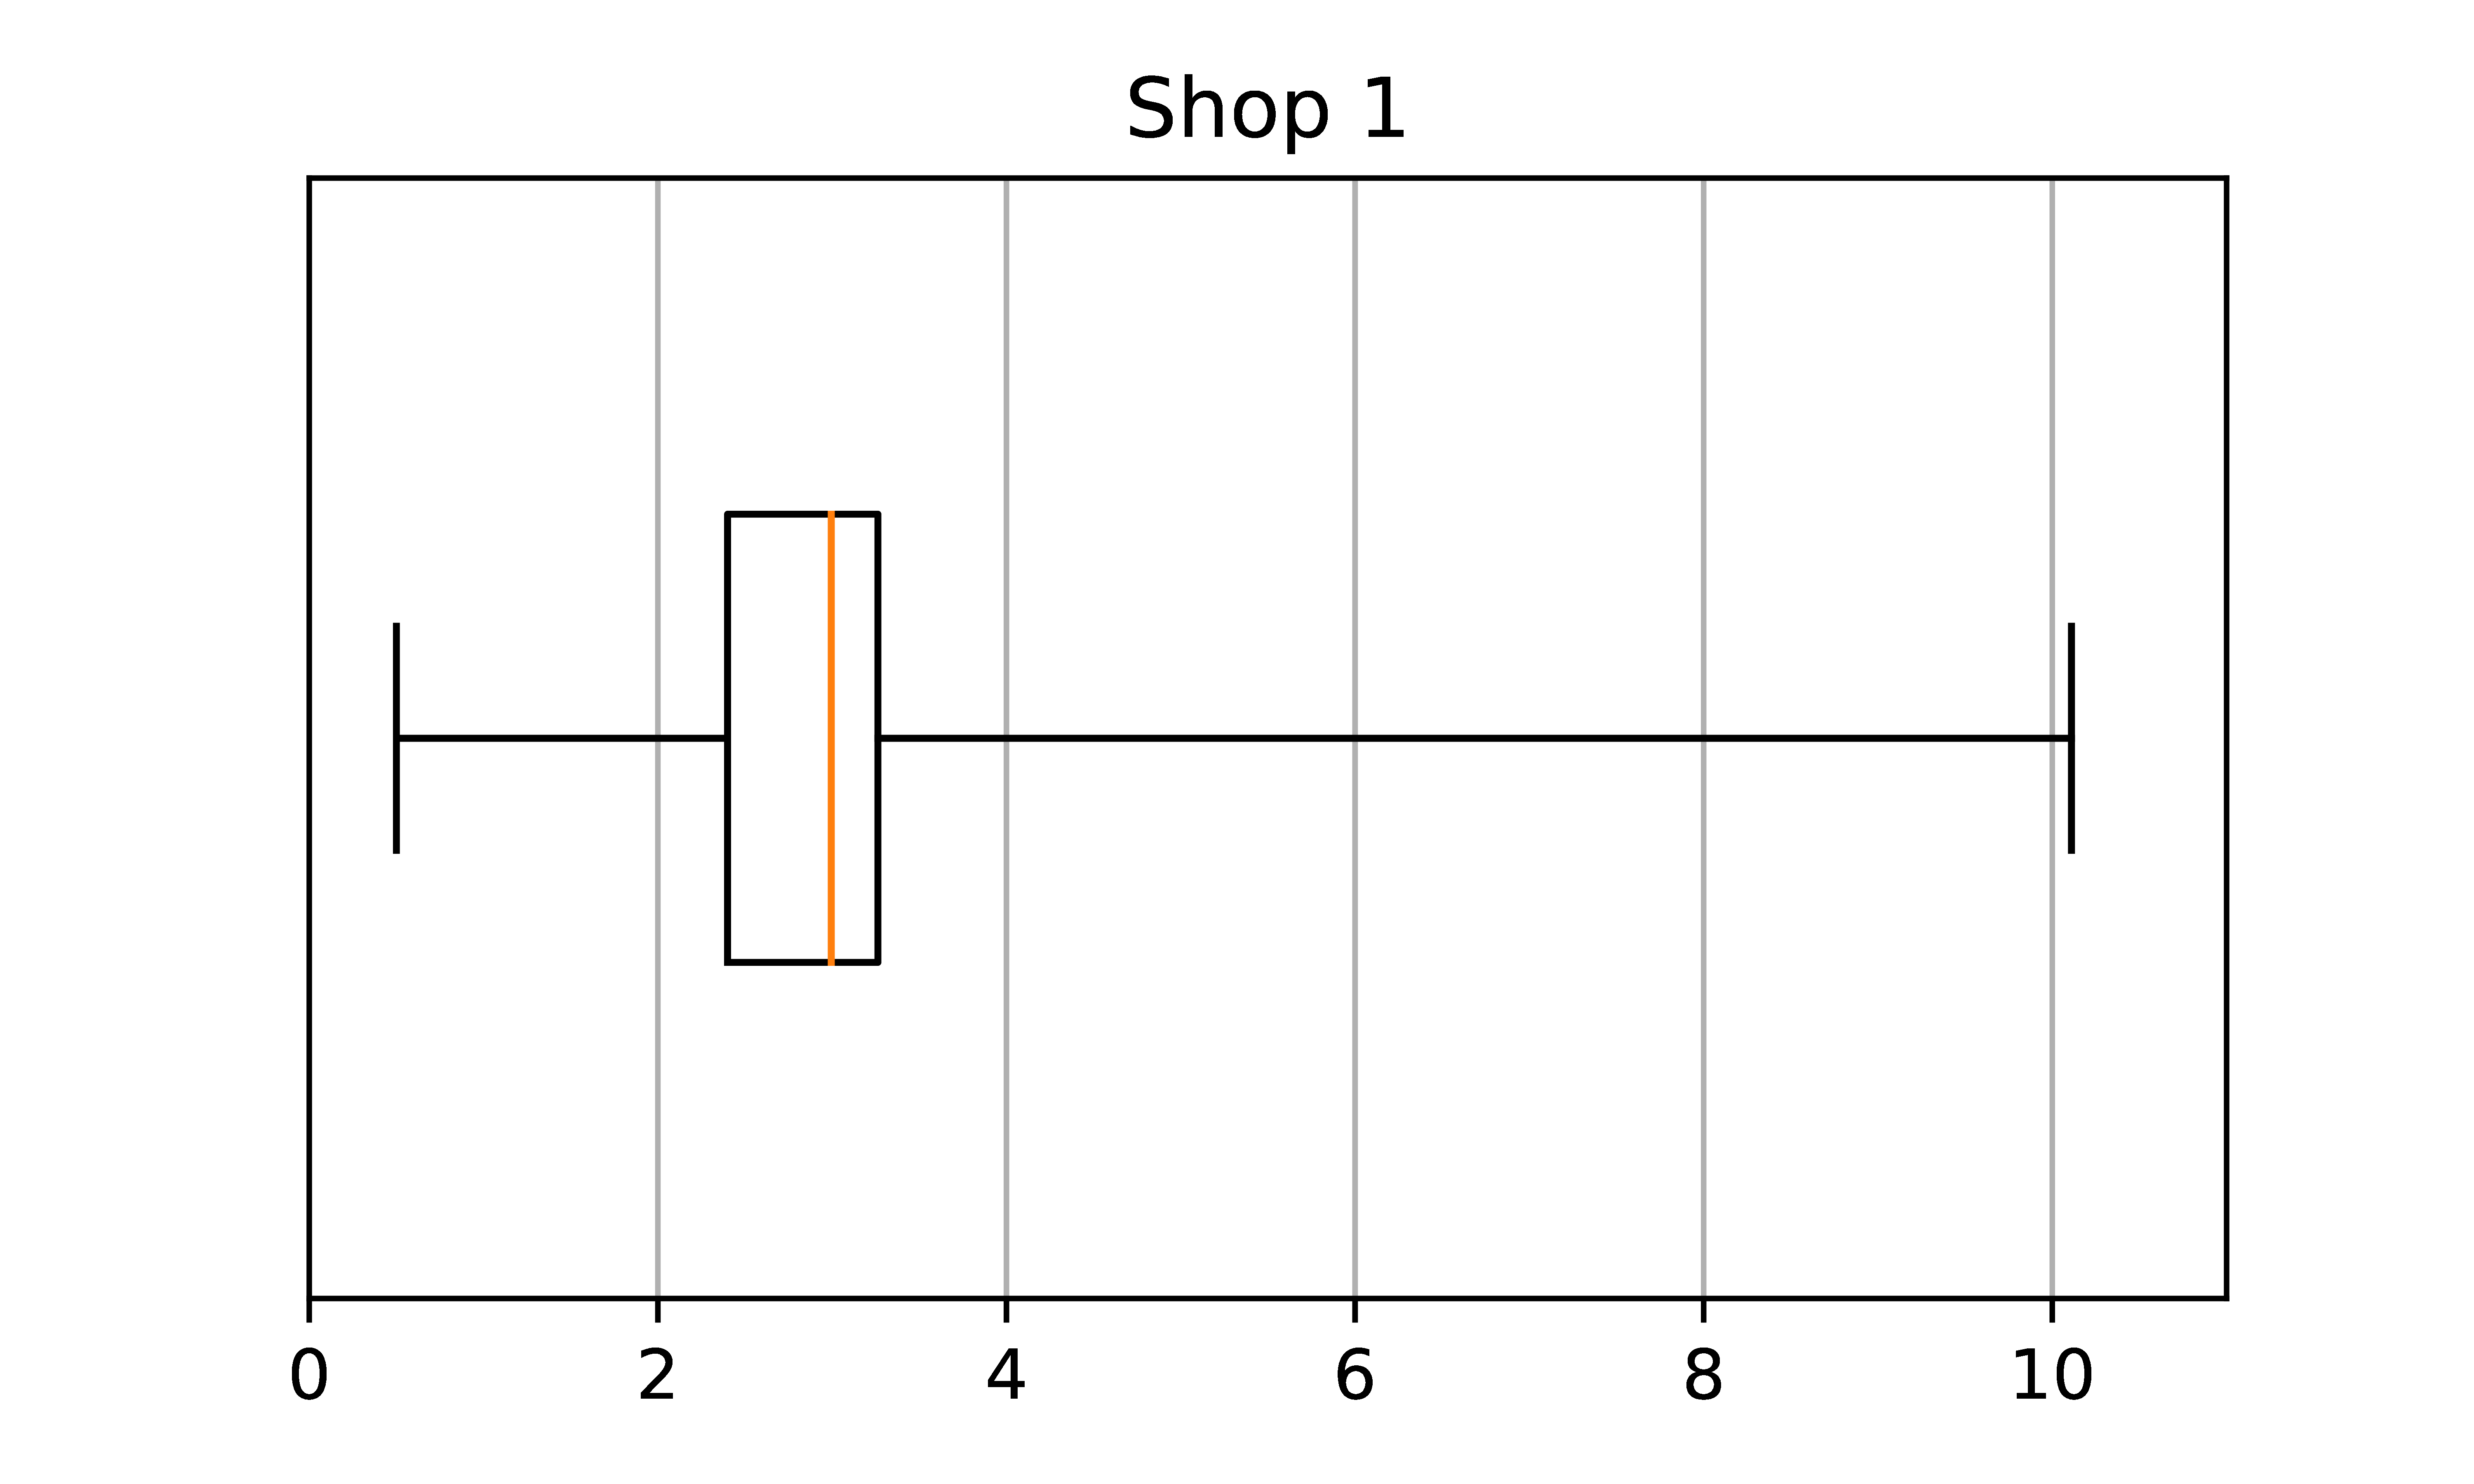

Shop 1 has a larger skewness and kurtosis.
Question F
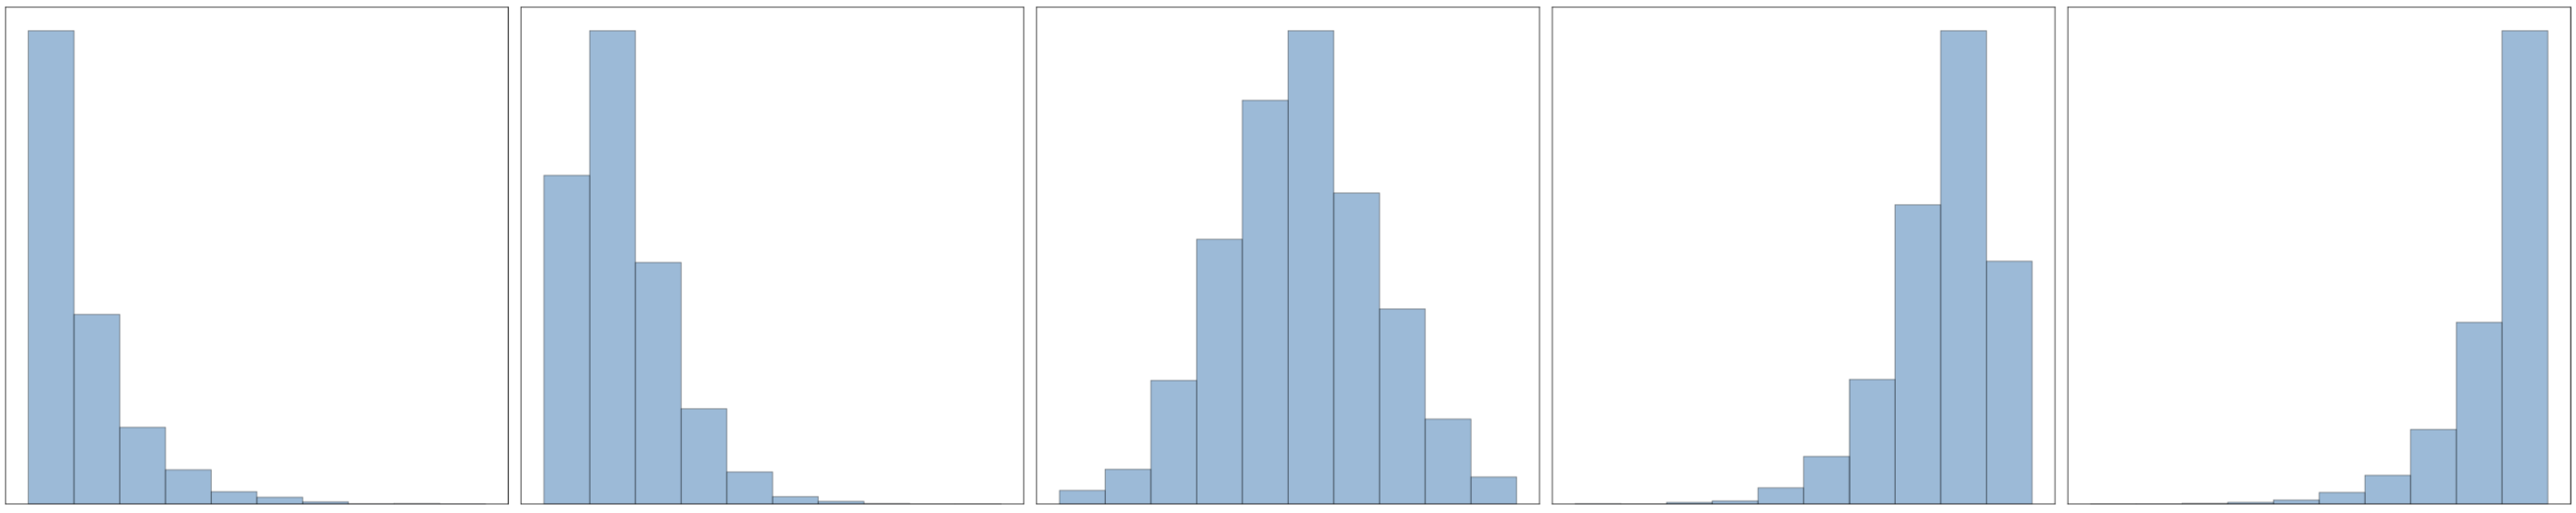
-
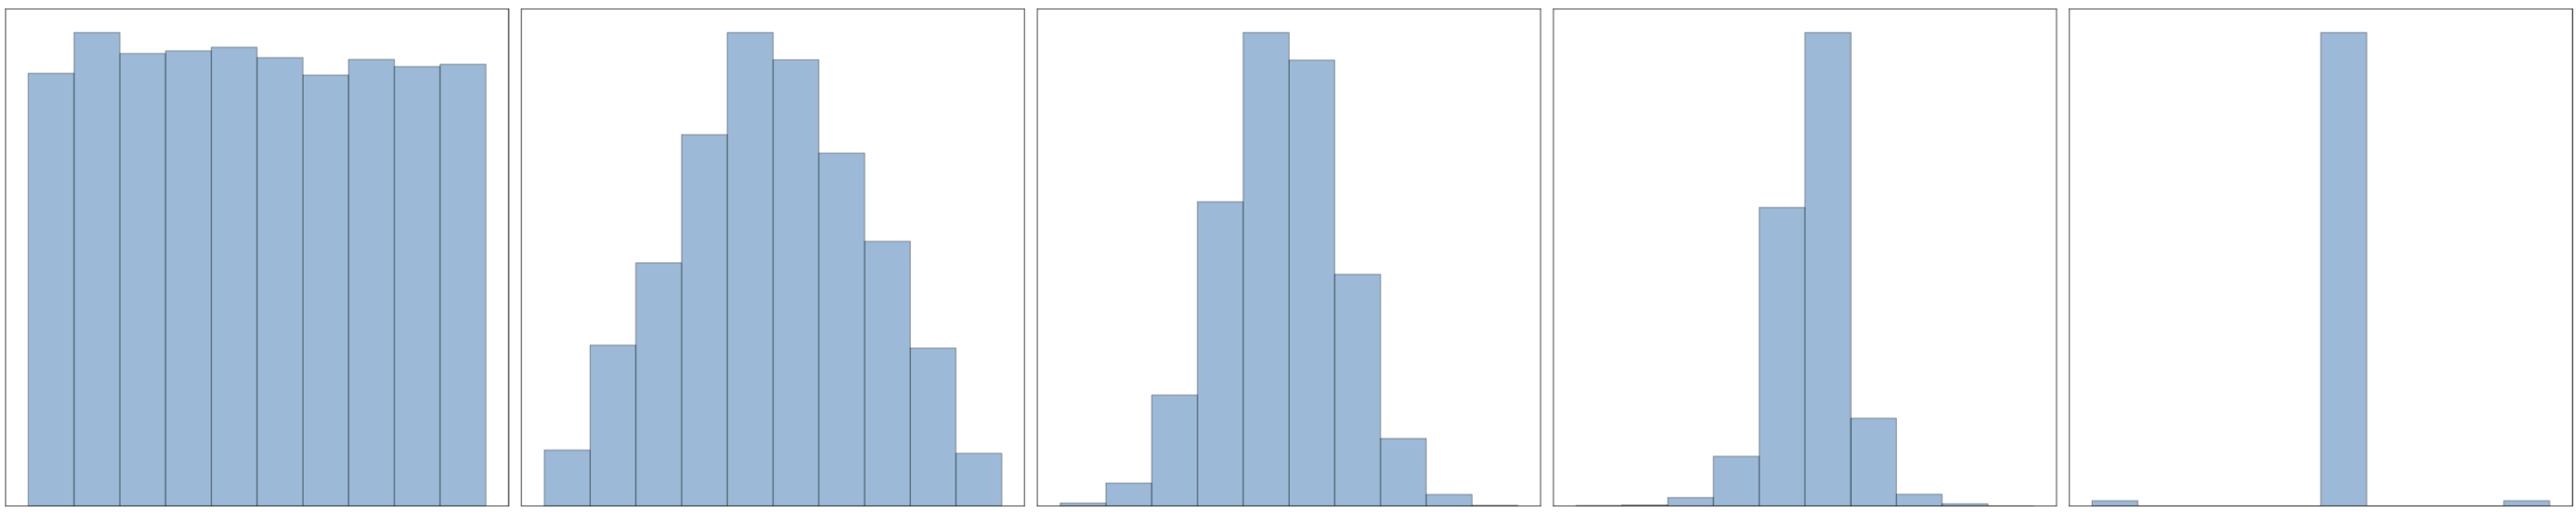
Put the following in order of skew:
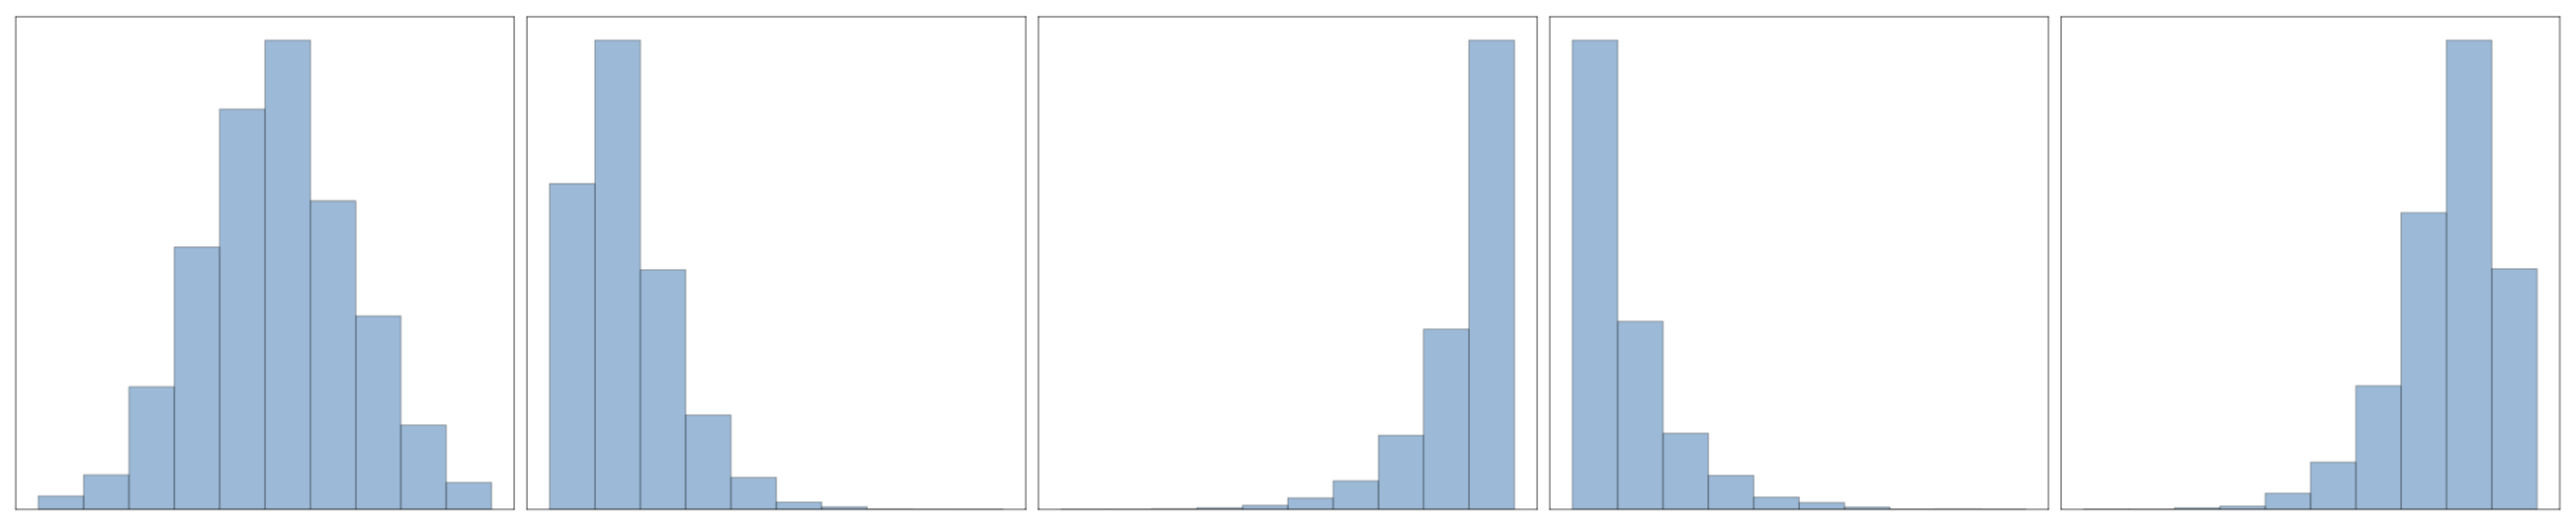
SOLUTION:
-
Put the following in order of kurtosis:
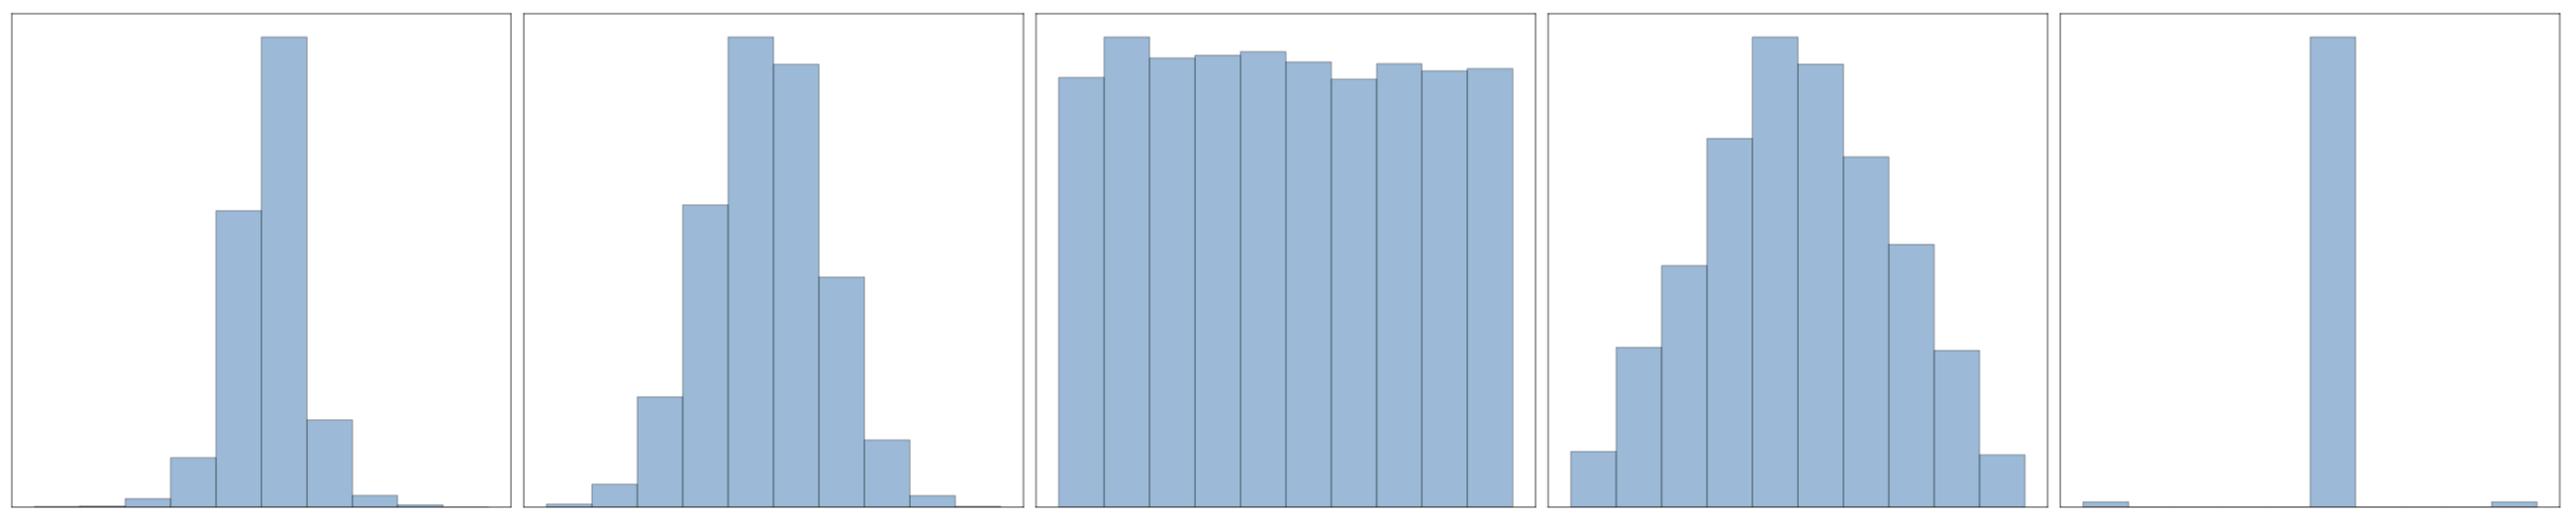
SOLUTION: