MA0004 - Preliminary Mathematics II
Course Schedule
- Mondays 9am-10am: Office hours (virtual). Scheduled time for you to watch the pre-recorded videos, drop into the office hours and ask any questions about the content or the course.
- Tuesdays 9am-11am: Tutorials (in-person). All tutorial workshops are interactive, you are expected to participate.
The following structure is used:
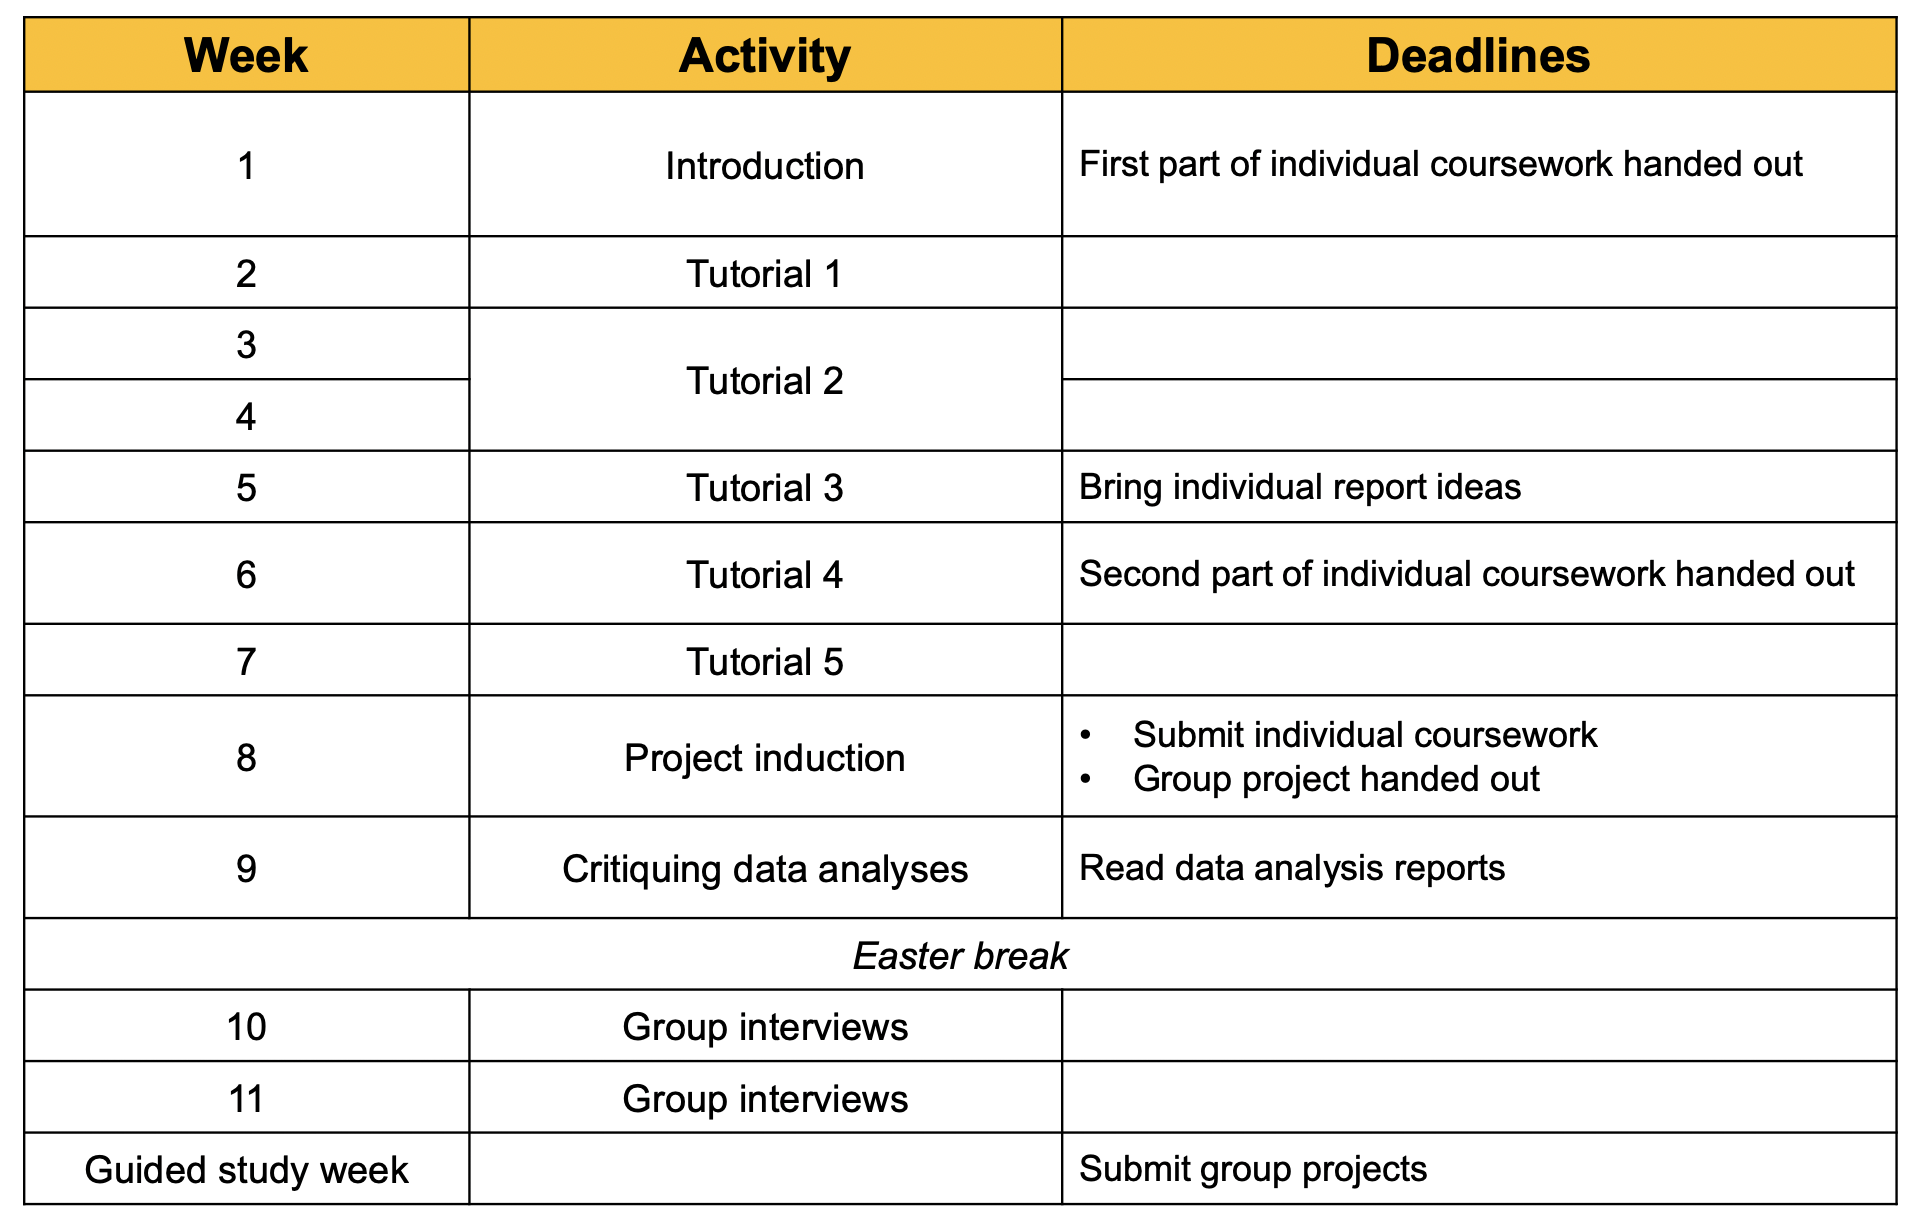
Assessment deadlines are also given, and discussing your progress on the assessment tasks will form an integral part of your learning experience. Please see the “Assessments” section below.
- Tutorial sessions
- Before each tutorial session you are expected to have watched all videos up to and including that chapter for that tutorial sheet.
- You are encouraged to work through the tutorial sheet before the tutorial.
- Tutorial sessions will take the following structure:
- Worked example as a class.
- Work on tutorial sheets in pairs / groups.
- Question and answer session on the week’s topic.
- Week 4 will also be an opportunity for us to discuss your individual report ideas.
- Critiquing data analysis reports
- Before this session you are expected to have read and made notes on the four following data analysis reports (there are pdfs of these on Learning Central):
- Group Interviews
- Sessions are split into timetabled 15 minute slots where I will chat with each coursework group in turn.
- Each week you will be given prompts to submit to submit different aspects of your work so far.
- These are opportunities for us to identify problems or misunderstandings, stretch your understanding, explore and discover new research questions, and critique and improve your work so far.
Learning Materials
The main form of delivery is a series of asynchronous videos for your to watch and re-watch in your own time. The video series is split into six chapters, and you are expected to watch all videos before the relevant tutorial for that chapter. Here’s the full playlist, and the videos split into relevant chapters below:
A - Introduction
- A1 - Me & the Course
Who am I, the course philosophy and structure.
- A2 - Asking Questions
Seeing data all around us, introduction to critiquing analyses.
- A3 - Foundations & Recap
Recapping fractions, algebra, and summation notation.
B - Sets (Tutorial Sheet 1, Solutions, Class exercises)
- B1 - Sets & Subsets
Initial definitions and examples.
- B2 - Power Sets
Constructing sets of subsets.
- B3 - Thinking Deeper
Historical context, Cantor's paradox, Russell's paradox.
- B4 - Set Operations
Union, intersection, complement, set difference.
- B5 - Example
Solving problems with set theory.
- B6 - Venn Diagrams
Visualising sets with Venn and Euler diagrams.
C - Probability (Tutorial Sheet 2, Solutions, Class exercises)
- C1 - Likelihood
Getting a feeling of chance, measures of chance.
- C2 - The Law of Large Numbers
Running trials, demonstration of the law of large numbers.
- C3 - Sequences of Events
Tree diagrams, probability of this then that.
- C4 - Combining Events
Probabilities of subsets, probabilities of set operations.
- C5 - Independence
Definition of independence, testing for independence.
- C6 - Conditional Probability
When probabilities change as other events occur.
- C7 - Bayes’ Theorem
Flipping the condition, using Bayes' theorem.
- C8 - Some Notorious Problems
Mr Smith's children, the liar's problem, the Monte Hall problem.
D - Data (Tutorial Sheet 3, Solutions, Class exercises)
- D1 - Data Types
Nominal, ordinal, interval, ratio.
- D2 - Measures of Centrality
Mean, median, mode.
- D3 - Measures of Spread
Range, quartiles, IQR, variance, standard deviation.
- D4 - The Use and Misuse of Statistics
Misinterpreting statistics, ambiguous statistics, lying with statistics, the inspection paradox.
- D5 - Data Visualisation (2 Variables)
Why we visualise, scatter, line and bar charts.
- D6 - Correlation vs Causation
Strength of correlation, types of correlation, misinterpreting correlation.
- D7 - Data Visualisation (1 Variable)
Visualising spread, histograms, boxplots, skewness, kurtosis.
- D8 - More Data Visualisation
Visualising more then two variables, bad data visualisations.
- D9 - Simpson’s Paradox
When groups have different trends to the whole.
E - Probability Distributions (Tutorial Sheet 4, Solutions)
- E1 - Discrete Probability Distributions
Probability mass functions, expected values, variance.
- E2 - Worked Examples
Calculating pmfs.
- E3 - Continuous Distributions
Probability density functions, cumulative distribution functions.
- E4 - The Normal Distribution
The bell curve, the S curve, the central limit theorem.
- E5 - The Standard Normal
Reading normal tables, calculating probabilities of Normal variables.
F - Statistical Inference (Tutorial Sheet 5, Solutions)
- F1 - Sampling
Why we sample, how we sample, sampling bias, survivorship bias.
- F2 - Hypothesis Testing
Infering population parameters from sample statistics, a feel for how it works.
- F3 - One Sample t-Test
Comparing a sample mean to a value.
- F4 - Paired Sample t-Test
Comparing the mean difference of two paired variables.
- F5 - Two Sample t-Test
Comparing means of independent variables.
- F6 - Nonparametric Tests
Possible solutions when your data doesn't meet the assumptions.
- F7 - Chi-Squared Test of Independence
Are two nominal or ordinal variables independent?
- F8 - Any Other Test?
Some other common things we can test for, p-hacking and bad practice.
Assessment
- Individual assessment (50%, hand-in date 21/03/2022)
- Part 1: Write a one page report on an interesting probability problem of your choice (ideas below), state and solve the problem, then either extend the problem or find/create data to demonstrate the problem.
- Part 2: Complete and submit the tutorial-style questions, which will be handed out in week 6.
- Group project (50%, hand-in date 12/05/2022)
- Write a 5 page data analysis report on either.
- The voting intentions data set,
- The hospital discharge data set,
- A data set of your choice (must be approved by the module lead).
- Submit an individual reflection form.
- Write a 5 page data analysis report on either.
The page limits are strict. If you submit a longer piece of work, I will not read past the page limit, even if that includes references.
The individual one page report, and the five page group project, will be marked using the same marking criteria:
- Comprehension (40%)
e.g.- Correct interpretation of materials
- Appropriate choice of probabilistic or statistical techniques
- Appropriate choice of summary statistics, data visualisations, and hypothesis tests
- Correct interpretation of results, summary statistics, data visualisations, and hypothesis tests
- All results and interpretations sense checked
- Organisation & Presentation (30%)
e.g.- Clarity of writing - easy to read
- Clarity of narrative - easy to follow
- Null and alternative hypotheses stated clearly and correctly
- Group work that reads as one coherent piece of work
- Technical Proficiency (20%)
e.g.- Accuracy and precision
- Originality & Creativity (10%)
e.g.- Citing others' work where appropriate
- Creative applications and/or extentions of the problem
- A deeper analysis of the data
Individual report ideas: the birthday problem, invent a casino game and describe the probabilities of winning or losing, coupon collector’s problem, Bertrand’s box paradox, the aeroplane boarding problem…
Reassessment
- If you need to resit the individual coursework: Complete and submit the following tutorial-style questions.
- If you need to resit the group coursework: Write a 5 page data analysis report on the housing market data set. The above marking criteria applies.