What's the chance of dying in a road accident before I'm 100?
A back-of-the-envelope calculation, sparked from a dinner table conversation in Windhoek this week, estimated the chance of me dying in a road accident before I turn one hundred years of age is roughly 0.00498. Roughly one in every 200 people. In this post I’ll try to improve the accuracy of this calculation.
The reason I was at that dinner table was to attend the very successful PyCon Namibia 2018, which was generously supported by Cardiff University’s Phoenix Project. At the dinner table were a group of mathematicians, earth scientists, anaesthetists, a programmer and a philosopher, when the following question was posed: “Each year 1 in 20,000 people die in a road accident in Britain, what’s the probability of dying in a road accident before turning a hundred years old?”
Let \(p = 1 / 20000\). Consider:
- After 1 year of living, there is probability \(p\) of dying in a road accident, and \((1 - p)\) of surviving to live another year.
- After the second year of living, there is a \(p + (1 - p)p\) chance of having died in a road accident (that is a chance \(p\) from year 1, after which you are dead, a probability \((1 - p)\) of getting to year two, and then a probability \(p\) again of dying once that initial survival has occurred). So there is a \((1 - p)^2\) chance of having survived all the way to the third year.
- By the same logic there is a \(p + (1 - p)p + (1 - p)^2p\) chance of having died in a road accident by the end of the third year.
This can be visualised in the probability tree below.
For 100 branches, that is 100 years of living, we sum up all the branch probabilities of dying. This gives:
\[P(\text{Dying in road accident within 100 years}) = \sum_{i=0}^{99} (1 - p)^i p\]This is essentially the Binomial distribution. When \(p = 1 / 20000\):
\[P(\text{Dying in road accident within 100 years}) \approx 0.00498\]Assumptions
The calculation above assumed some unrealistic things:
- The probability of dying in a road accident is the same for each age group.
- If I do not die in a car accident, then I cannot die of anything else.
Tweaking the model
Tweaking the above equation slightly, these unrealistic assumptions can be addressed:
\[P(\text{Dying in road accident within 100 years}) = \sum_{i=1}^{100} \left(\prod_{k=1}^{i}(1 - m_{k-1})\right) p_i\]where \(p_i\) is the probability of dying in a road accident during the \(i^{\text{th}}\) year of your life, and \(m_i\) is the probability of dying of anything during the \(i^{\text{th}}\) year of your life. \(m_0 = 0\) by definition, as you cannot die before being born. This is shown in the modified probability tree below:
This mortality data split by age can be openly obtained for the ONS, and population data will also be useful. The data sets I downloaded are for 2016, but are for England and Wales only. This data also bins ages into age groups:
With some data cleaning, I can obtain:
| Age Group | Population | All Deaths | Road Deaths |
|---|---|---|---|
| < 1 | 702,448 | 2711 | 0 |
| 1 - 4 | 2,899,859 | 433 | 18 |
| 5 - 14 | 2,899,859 | 525 | 35 |
| 15 - 24 | 7,132,934 | 2153 | 324 |
| 25 - 34 | 7,944,899 | 4364 | 296 |
| 35 - 44 | 7,448,495 | 8550 | 201 |
| 45 - 54 | 8,190,797 | 21200 | 257 |
| 55 - 64 | 6,695,865 | 41577 | 180 |
| 65 - 74 | 5,765,980 | 87556 | 181 |
| 75 - 84 | 3,342,771 | 148655 | 185 |
| ≥ 85 | 1,408,727 | 207314 | 87 |
Now mortality for each group is the Population divided by All Deaths, and the road mortality for each group is the Population divided by Road Deaths. And \(m_i\) is simply the mortality for the age group that \(i\) belongs to, and \(p_i\) is the road mortality for the age group that \(i\) belongs to.
Why do we need this level of detail? Well mortality is very sensitive to age, with infants and elderly people much more at risk of dying than the rest of the population. This is shown in the bar chart below:
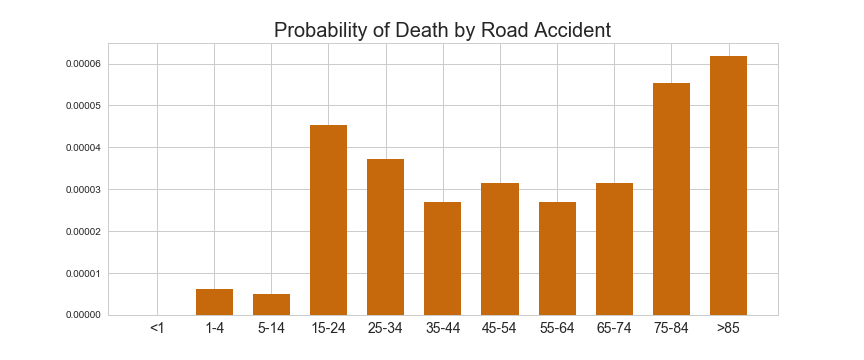
While the road mortality, also sensitive to age, is higher for teenagers and young adults:
Now substituting in the calculated \(m_i\)’s and \(p_i\)’s into the modified equation, we get much more accurate probability of dying:
\[P(\text{Dying in road accident within 100 years}) = \sum_{i=1}^{100} \left(\prod_{k=1}^{i}(1 - m_{k-1})\right) p_i \approx 0.00255\]that is around 1 in every 400 people.
Finally lets look at \(P(\text{Dying in road accident within } x \text{ years})\). The plot below shows this as the age \(x\) varies. We see that the chances are fairly small until we reach our late teens (when we begin driving) and steadily increases year by year.