Torchwood: The Maths of 'Miracle Day'
I’ve been watching a lot of Torchwood recently (contender for best TV show ever), which is a sci-fi ‘grown-up’ spin-off of Doctor Who (the other contender for best TV show ever), which is mainly set in Cardiff and South Wales. The fourth series however, titled “Miracle Day”, takes the action stateside. This is science fiction, but the science in this series is healthcare operational research.
The premise: one day all humans on Earth stop dying.
A major subplot of this is working out how does the healthcare system cope with the ‘miracle’? I want to investigate further.
Population Growth
An important theme of this series is overpopulation, with the opening titles showing an increasing count of the Earth’s population. In episode one, our hero Gwen Cooper and her former police officer colleague Andy discuss the consequences of the miracle on population growth:
ANDY: Here we go, look. Planet Earth. On average, three hundred thousand people die every day. So if they stop dying, that’s an extra what, million people in just over three days. Add to that five hundred thousand people born every day.
GWEN: That’s another million every two days plus the first million. Bloody hell.
ANDY: That’s the fastest population boom in history.
GWEN: We’re gonna run out of room.
Yep. But that back of the envelope calculation also misses out some vital details: the less people die, the more people will be born. This is an example of a dynamical system, where rates of change depend on the system state.
Let’s model the Earth’s population in a compartmental model: let \(C\) be the number of children in the world (who cannot give birth), let \(F\) be the number of adults of fertile age in the world, and let \(I\) be the number of adults infertile due to age.
Also define:
- \(P = C + F + I\), the population of Earth,
- \(g_c\), the rate at which children grow to be adults,
- \(g_o\), the rate at which adults become infertile due to age,
- \(b\), the birth rate,
- \(m\), the mortality rate.
Crude estimates give \(g_c = \frac{1}{15}\) (fertile at 15), \(g_o = \frac{1}{50}\) (infertile at 65). Wikipedia gives that 26% of the world is \(C\), 9% of the world is \(I\), and so 65% of the world is \(F\). It also gives that the birth rate is 18.5 births per thousand people, thus the birth rate for \(F\) is \(b=0.0285\); while the mortality rate is 7.8 per thousand people, thus \(m = 0.0078\). Torchwood opening credits give the initial world population at the start of the miracle day as 6,928,198,257; thus our initial compartment sizes are \(C(0) = 1,801,331,547\), \(F(0) = 4,503,328,867\), and \(I(0) = 623,537,843\).
The compartmental model can is set up:
\[\begin{align} \frac{dC}{dt} &= bF - (m + g_c)C \\ \frac{dF}{dt} &= g_c C - (m + g_o)F \\ \frac{dI}{dt} &= g_o F - m I \end{align}\]Note that this is still a crude model, which doesn’t take into effect a number of factors such as the lack of abortions and miscarriages, and different mortality rates for each category of people.
Now using Python’s odeint function from scipy.integrate we can observe this system over a ten year period. Let’s compare a miracleless world, \(m = 0.0078\), with miracle day, \(m = 0\):
>>> def derivatives(y, t, mortality_rate=0.01):
...     birth_rate = 0.0285
...     gc = 1/15
...     go = 1/50
...     C, F, I = y
...     dCdt = (birth_rate * F) - ((mortality_rate + gc) * C)
...     dFdt = (gc * C) - ((mortality_rate + go) * F)
...     dIdt = (go * F) - (mortality_rate * I)
...     return dCdt, dFdt, dIdt
>>> from scipy.integrate import odeint
>>> import numpy as np
>>> y0 =(1801331547, 4503328867, 623537843)
>>> t = np.arange(0, (365 * 10) + 0.01, 0.01)
>>> results = odeint(derivatives, y0, t, args=(0.0078,))
>>> C, F, I = results.T
>>> P_nomiracle = C + F + I
>>> results = odeint(derivatives, y0, t, args=(0,))
>>> C, F, I = results.T
>>> P_miracle = C + F + INow comparing P_nomiracle to P_miracle we can see the effect of the miracle on the Earth’s population:
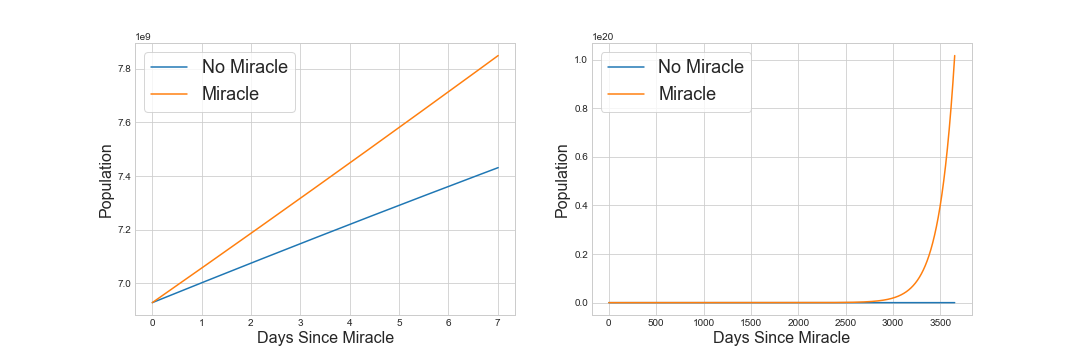
The Earth’s population displays exponential growth as expected. In the first week the Earth gains an extra 0.4 billion humans, while the 10 year outlook looks dire. Torchwood better sort something out soon!
Hosptial Bed Prioritisation
Now just because everyone’s immortal, that doesn’t mean people are not sick and injured. Hospitals are under enormous strain, and are quickly overrun and running out of beds. In episode two, in a hospital in Washington DC, Doctor Vera Juarez suddenly realises they’re prioritising their patients incorrectly:
VERA: Oh my God, we’re doing it wrong. Everyone, we’re doing it wrong.
DOCTOR: We don’t have time.
VERA: We have nothing but time. Nobody is expectant here. Nobody’s gonna die. The first sixty minutes after a trauma, the golden hour? There’s no golden hour anymore. All our reflexes are wrong.
DOCTOR: I don’t understand. What do you want us to do?
VERA: Don’t you see? Even the worst injured aren’t gonna die. So we need to do this backwards. Reverse it. We’re desperate for beds so we treat the minor injuries first. If you can get somebody out of here in ten minutes, get them out. Free up the beds for the ones who need help.
Seems to make sense. Let’s investigate by simulating a system under both prioritisation schemes, pre- and post-miracle.
We’ll use Ciw to simulate a simple example hospital under the two prioritisation systems: pre-miracle where the most severe triage categories are treated before the less severe; and post-miracle where the least severe are treated before the most severe. Let’s say there are five triage categories, the more severe the patient the longer they take to be treated, but they arrive less frequently than the less severe triage category patients.
Let’s make up some some parameters for illustration:
>>> import ciw
>>> N_premiracle = ciw.create_network(
...     arrival_distributions={
...         'Class 0': [ciw.dists.Exponential(1)],
...         'Class 1': [ciw.dists.Exponential(2)],
...         'Class 2': [ciw.dists.Exponential(4)],
...         'Class 3': [ciw.dists.Exponential(8)],
...         'Class 4': [ciw.dists.Exponential(16)]
...     },
...     service_distributions={
...         'Class 0': [ciw.dists.Exponential(1/5)],
...         'Class 1': [ciw.dists.Exponential(1)],
...         'Class 2': [ciw.dists.Exponential(3)],
...         'Class 3': [ciw.dists.Exponential(12)],
...         'Class 4': [ciw.dists.Exponential(48)]
...     },
...     number_of_servers=[14],
...     priority_classes={
...         'Class 0': 0,
...         'Class 1': 1,
...         'Class 2': 2,
...         'Class 3': 3,
...         'Class 4': 4
...     }
... )
and
>>> N_postmiracle = ciw.create_network(
...     arrival_distributions={
...         'Class 0': [ciw.dists.Exponential(1)],
...         'Class 1': [ciw.dists.Exponential(2)],
...         'Class 2': [ciw.dists.Exponential(4)],
...         'Class 3': [ciw.dists.Exponential(8)],
...         'Class 4': [ciw.dists.Exponential(16)]
...     },
...     service_distributions={
...         'Class 0': [ciw.dists.Exponential(1/5)],
...         'Class 1': [ciw.dists.Exponential(1)],
...         'Class 2': [ciw.dists.Exponential(3)],
...         'Class 3': [ciw.dists.Exponential(12)],
...         'Class 4': [ciw.dists.Exponential(48)]
...     },
...     number_of_servers=[14],
...     priority_classes={
...         'Class 0': 4,
...         'Class 1': 3,
...         'Class 2': 2,
...         'Class 3': 1,
...         'Class 4': 0
...     }
... )
Now we’ll compare how crowded the hospitals are comparing average amount of patients in the system at any time. This takes a little bit of work to calculate:
>>> import pandas as pd
>>> def get_crowd_size(N):
...     Q = ciw.Simulation(N)
...     Q.simulate_until_max_time(400)
...     recs = Q.get_all_records()
...     people_at_arrivals = [(r.arrival_date, r.queue_size_at_arrival + 1) for r in recs]
...     people_at_departures = [(r.exit_date, r.queue_size_at_departure) for r in recs]
...     crowd = sorted(people_at_arrivals + people_at_departures, key=lambda x: x[0])
...     crowd_df = pd.DataFrame(
...         {"date": [x[0] for x in crowd], "people": [x[1] for x in crowd]}
...     )
...     crowd_df["date interval"] = crowd_df["date"].diff()
...     crowd_df = crowd_df[crowd_df["date"] >= 35]
...     return (crowd_df["date interval"] * crowd_df["people"]).sum() / 365
To account for variability we’ll run 25 trials of each system:
>>> def get_average_crowd_size(N):
...     crowd_sizes = []
...     for trial in range(25):
...         ciw.seed(trial)
...         crowd_sizes.append(get_crowd_size(N))
...     return sum(crowd_sizes) / len(crowd_sizes)
Now, pre-miracle, under normal prioritisation (treating the most severe first), we get:
>>> get_average_crowd_size(N_premiracle)
15.093945104963574
which is 15.1 patients in the hospital on average. And, post-miracle, under the new prioritisation (treating the least severe first), we get:
>>> get_average_crowd_size(N_postmiracle)
9.930771001044622
which is 9.9 patients in the hospital on average. So Vera’s proposal works! Under the new prioritisation the hospital becomes less crowded. Of course, with no one dying the arrival rates would skyrocket anyway, so Torchwood, do your thing!