Day-tripping to the Science Museum
Last weekend I took a trip to London and visited the (free!) Science Museum. It is a huge museum and I didn’t even finish exploring one floor, but one of the rooms I did enjoy was the Winton Gallery dedicated to mathematics. Here are four artefacts, related to my teaching or research, I found particularly interesting:
-
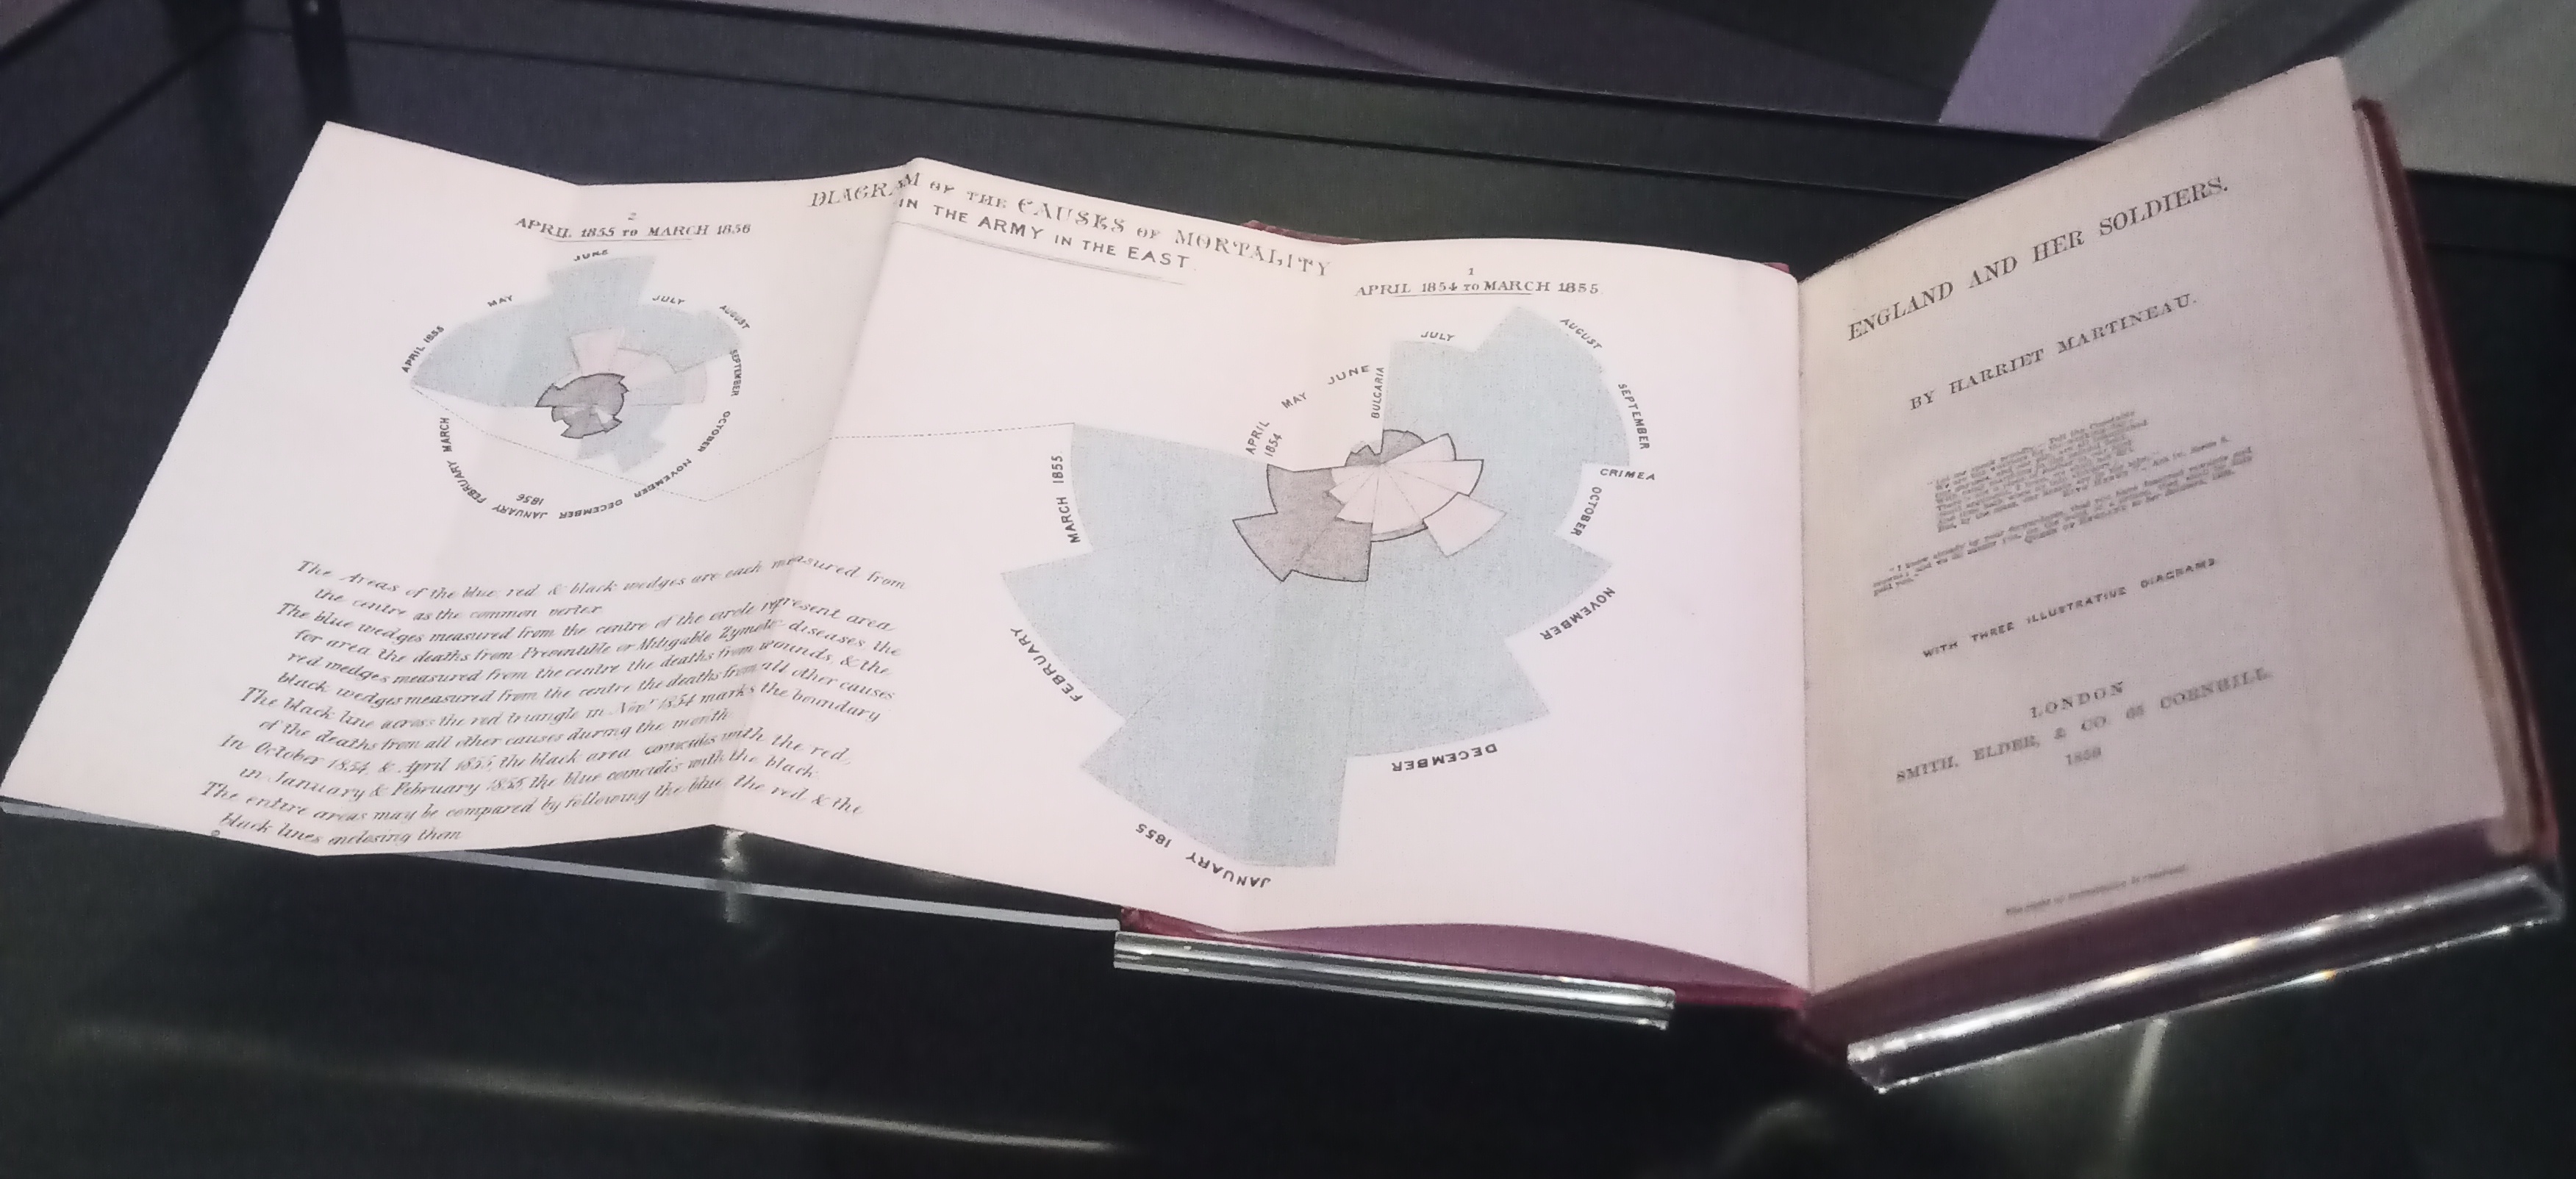
Florence Nightingale’s Data Visualisations (1859)
This book by sociologist Harriet Martineau contains early data visualisations devised by Florence Nightingale. This rose diagram was chosen by Nightingale specifically to show the cyclic nature of the year and its affect on mortality. She pioneered data-driven nursing, including the use of data visualisation. It’s hard to imagine how people understood anything before visualising data!
-
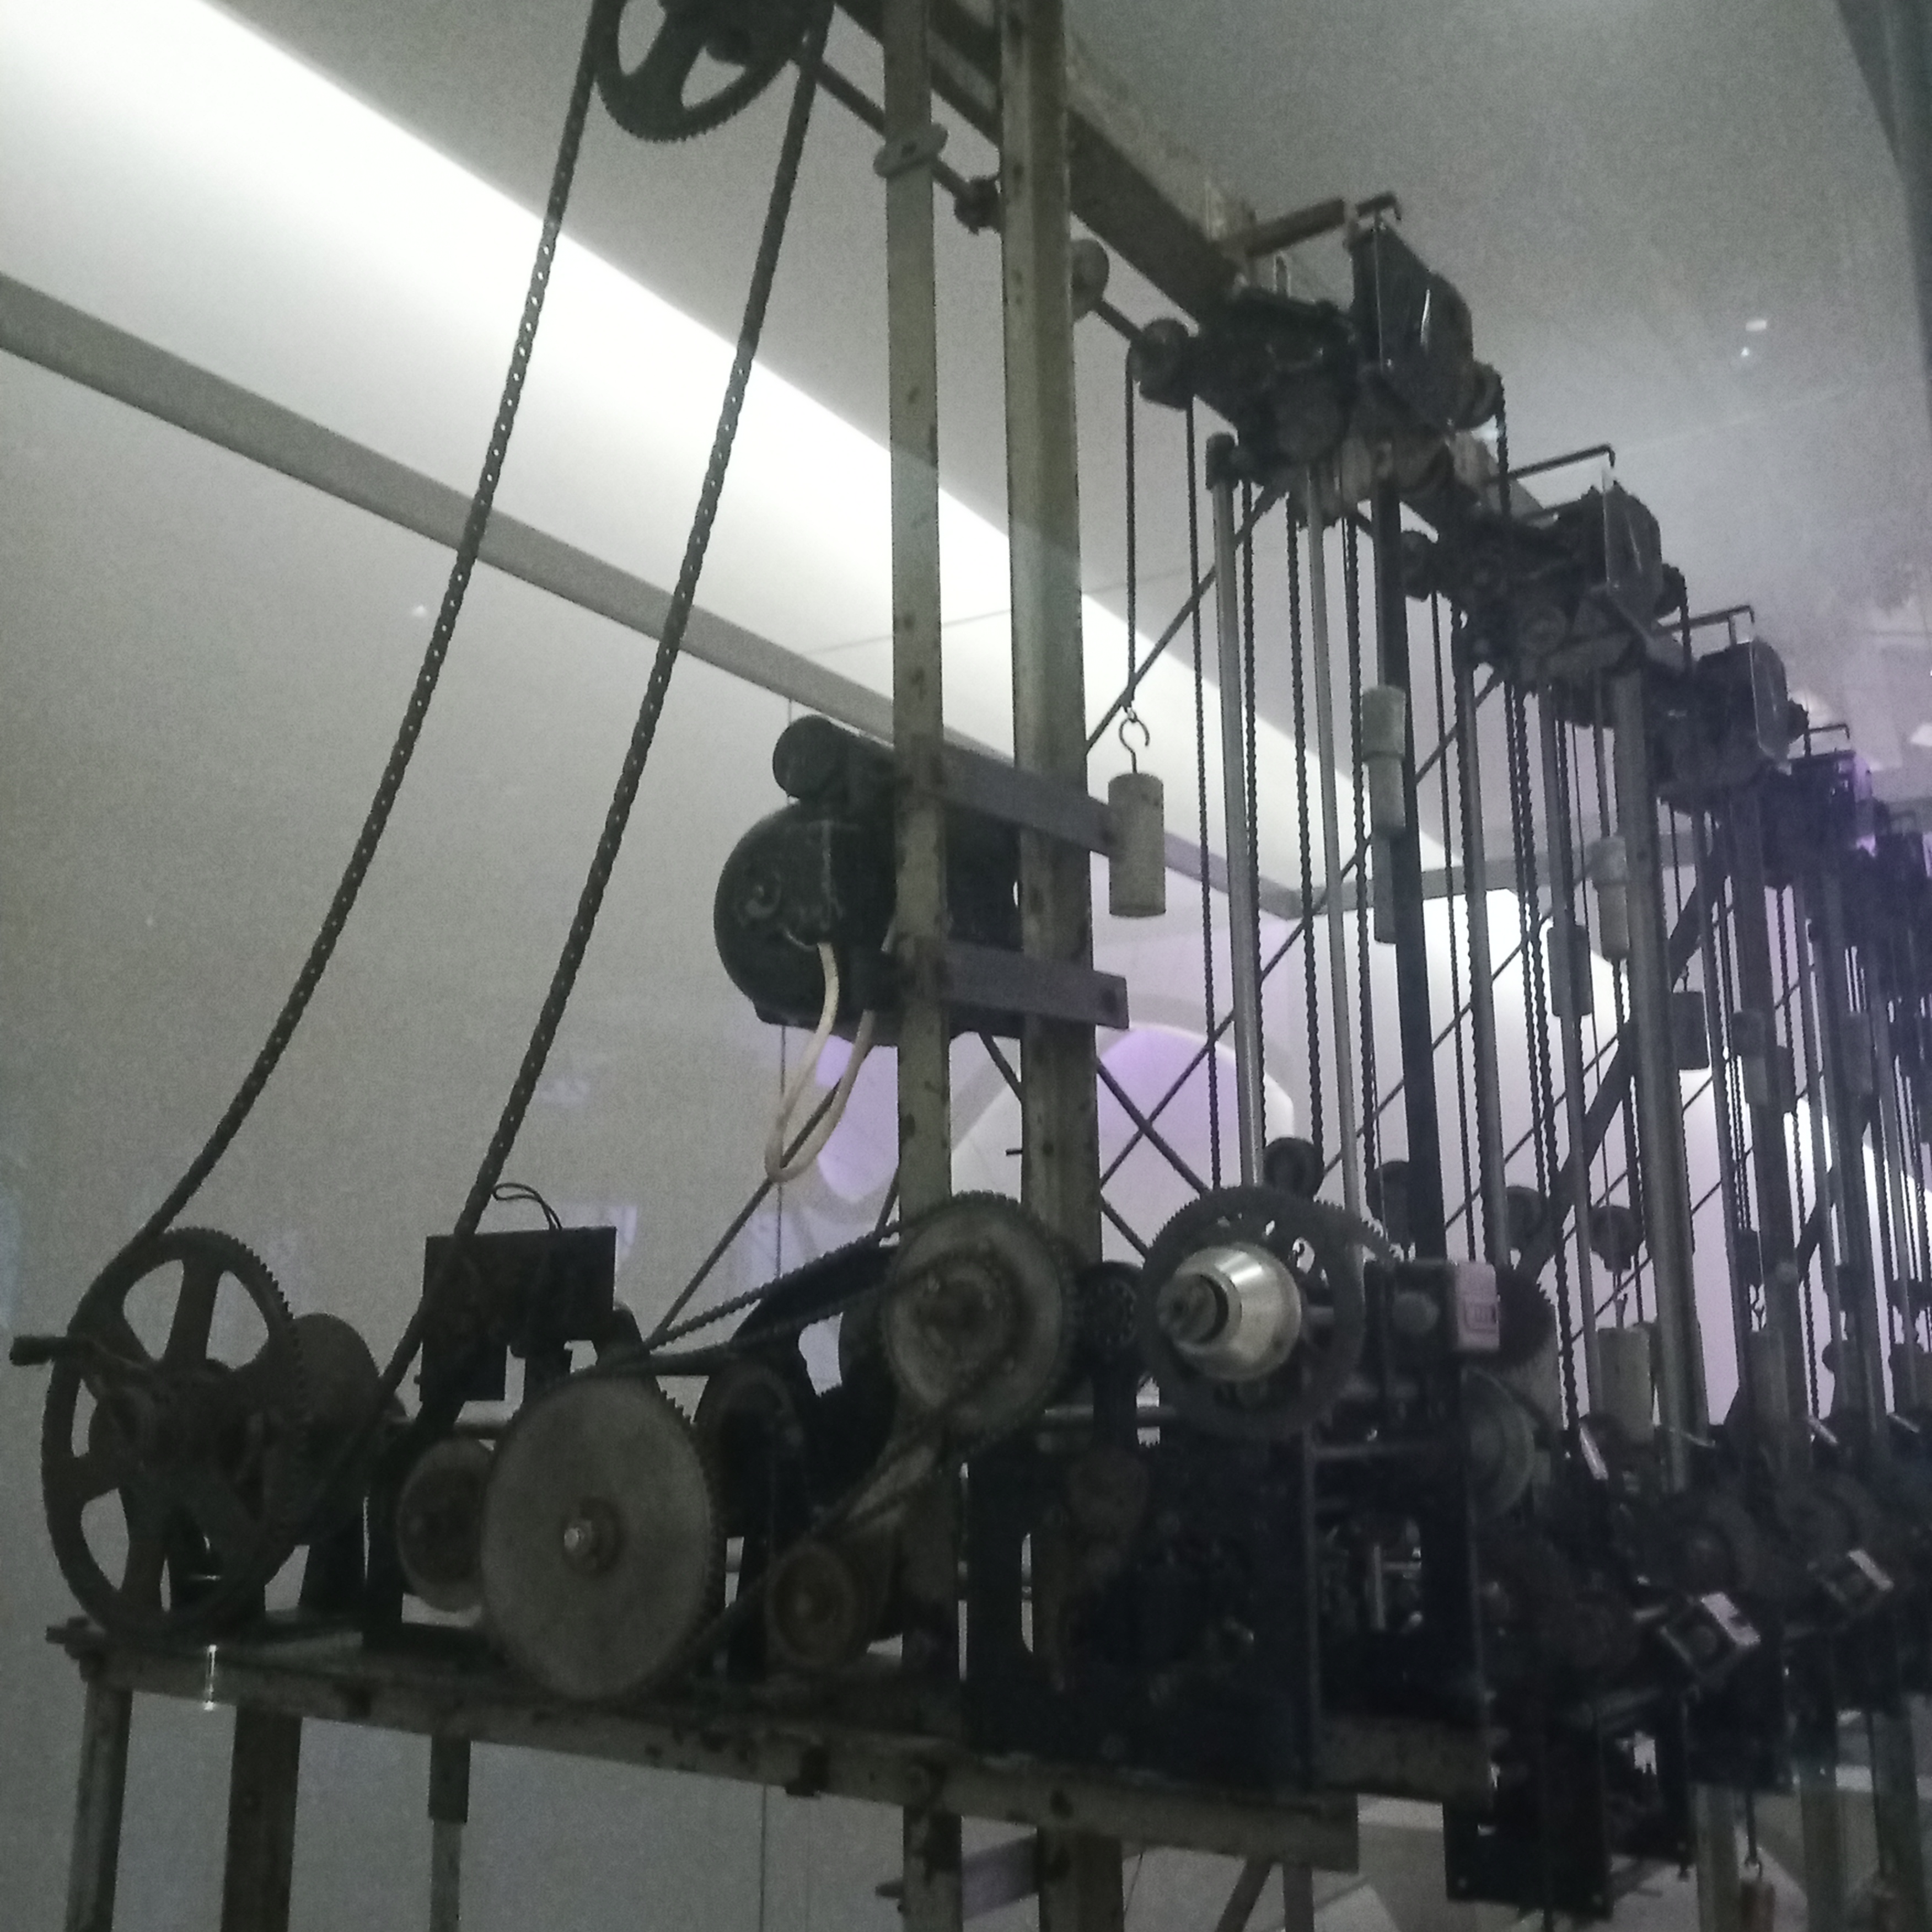
Julius’ Totaliser Odds Calculator (1933)
In 1928 totes or parimutuel betting began for horse and greyhound racing in Britain, meaning that odds were calculated based on total bets, rather than having fixed odds. Odds needed to be calculated quickly and so this machine was devised by New Zealander George Julius. The horizontal positions represent the investment on each of the runners in the race; the vertical position is equal for each, and represents the total stake. Therefore the gradient of the hypotenuse, that is the cotangent of the angle, represents the odds. I like here how combining two disciplines, geometry and probability, allowed efficient practical applications.
-
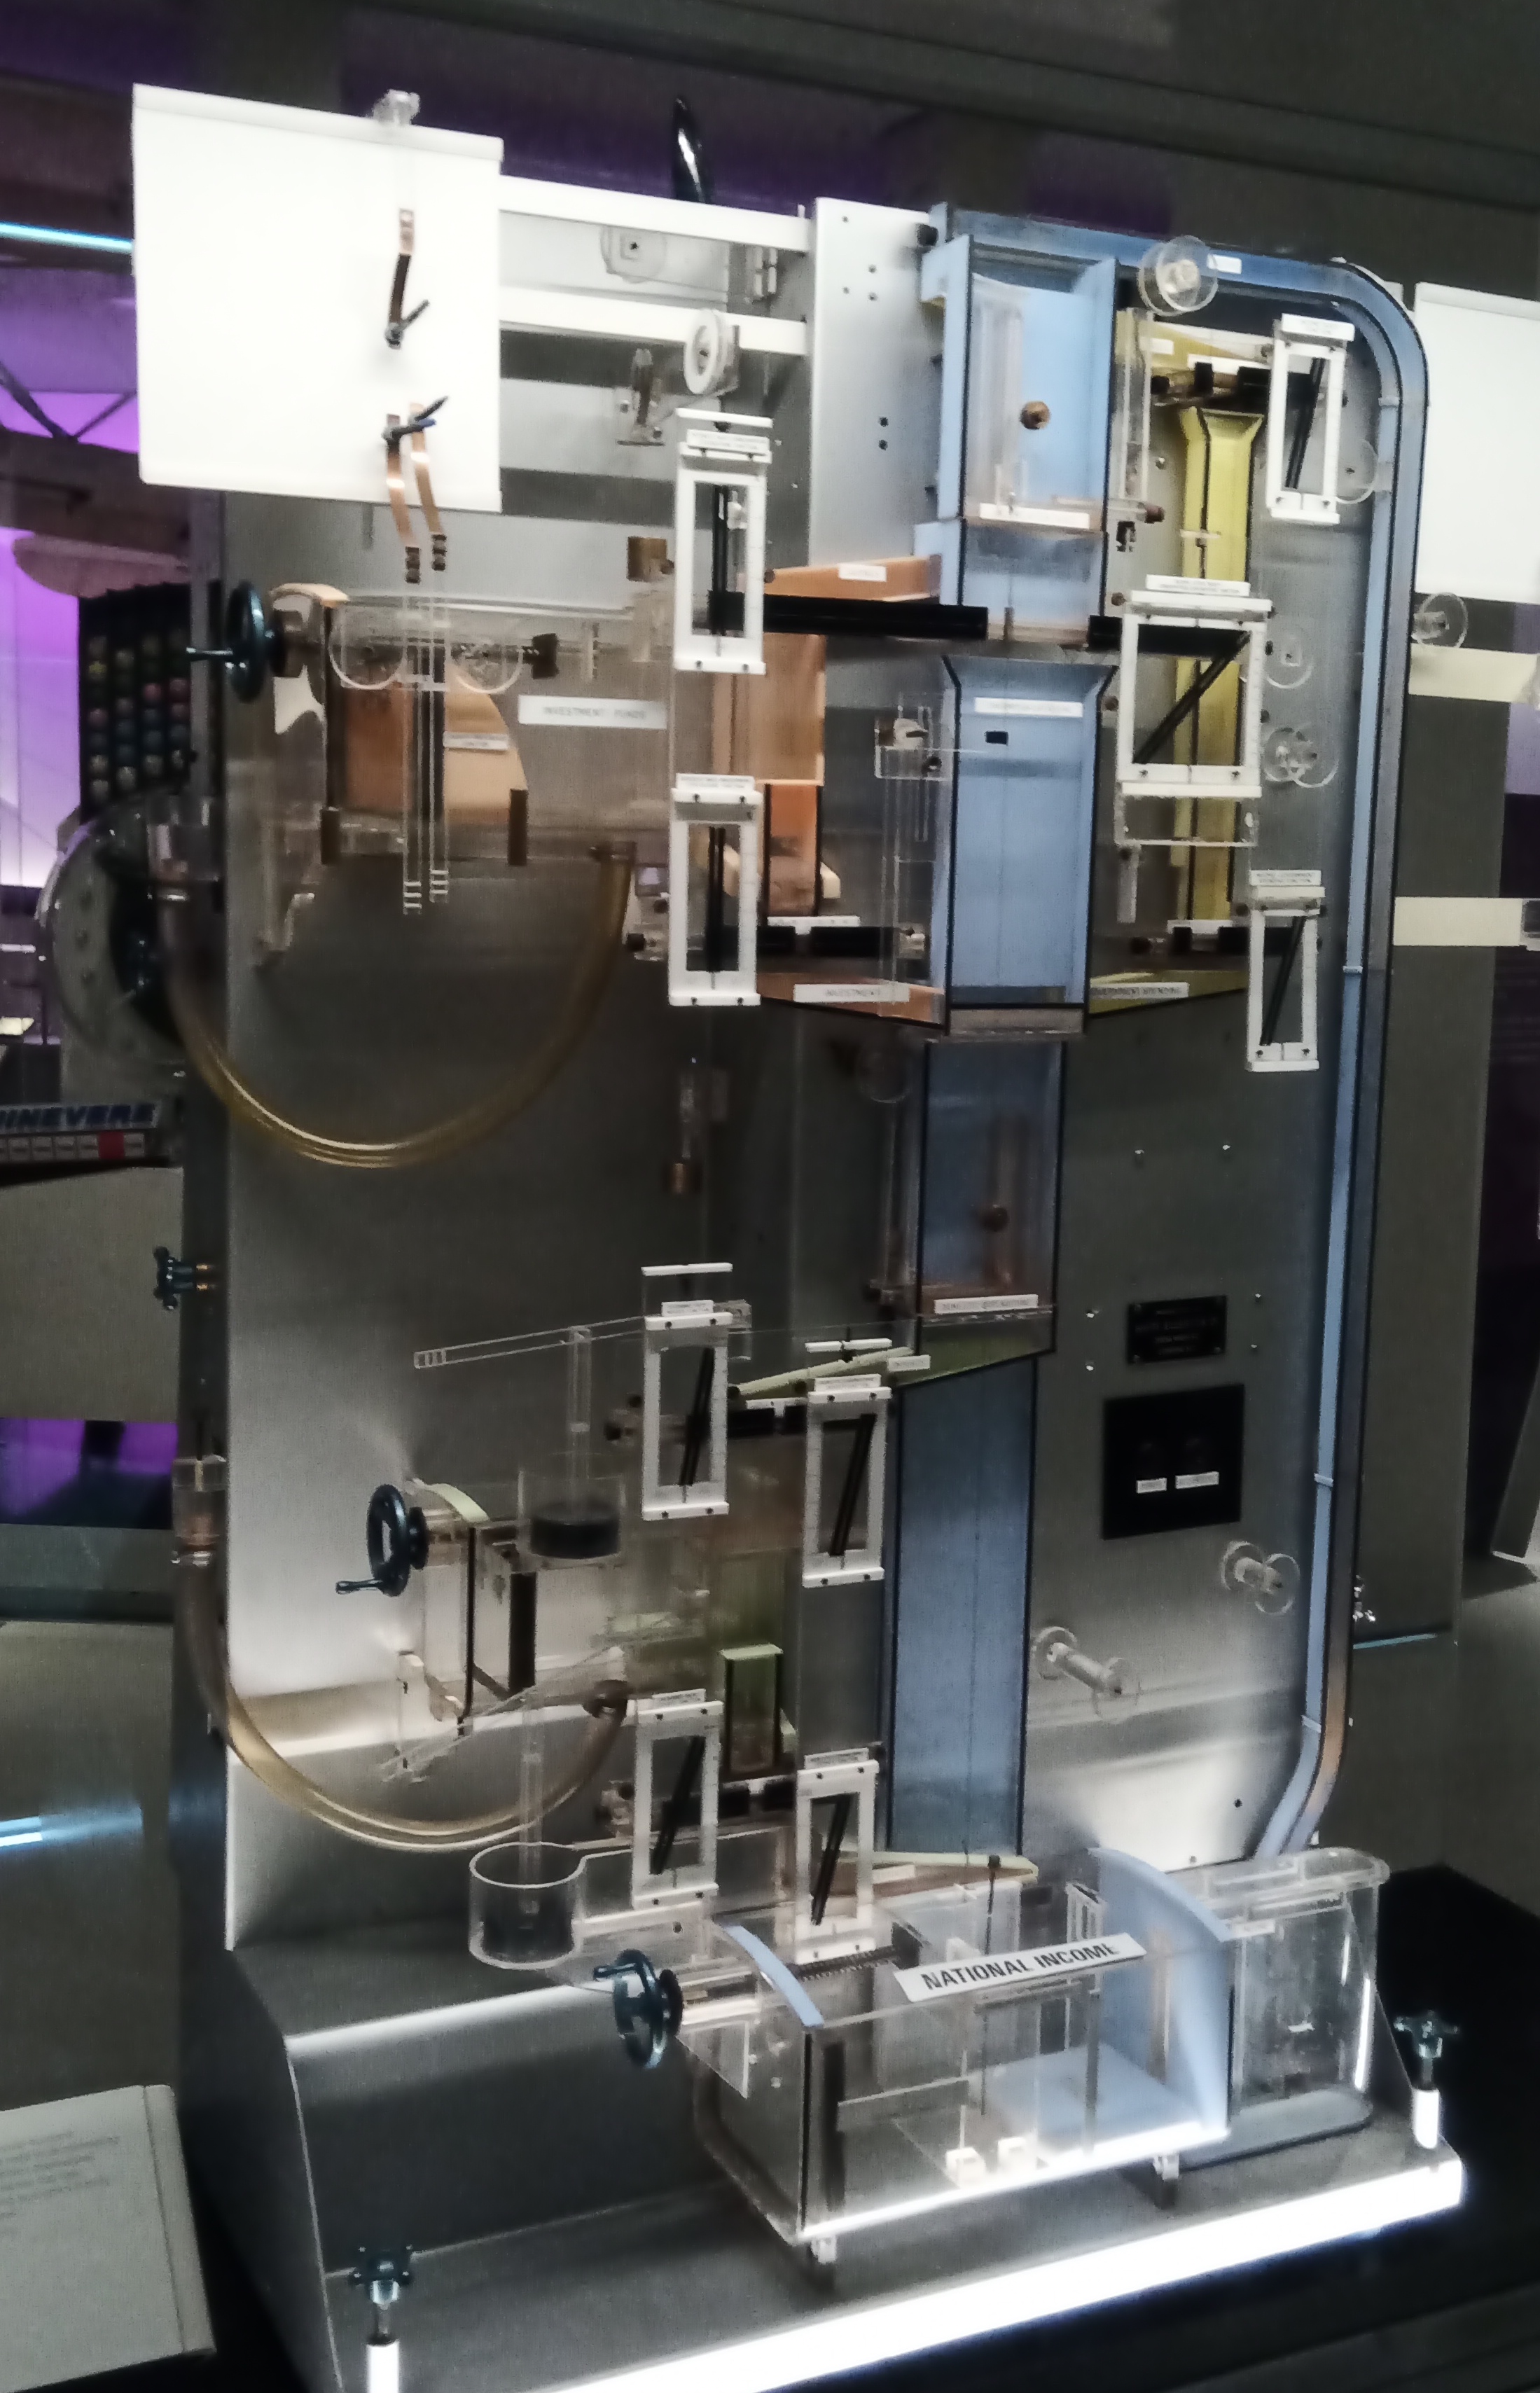
Bill Phillips’ Model of the Economy (1949)
This machine, devised by another New Zealander Bill Phillips, is a physical visualisation of the economy, using water! The flows of water through various valves and storage tanks represent different parts of the economy, for example income, savings, spending, etc. The neatest thing about this is that the underlying mathematical model is a set of differential equations, that is systems dynamics. And how do we conceptualise systems dynamics? Stock and flow diagrams. That’s exactly this, but in physical form! A decade or so before Forrester.
-
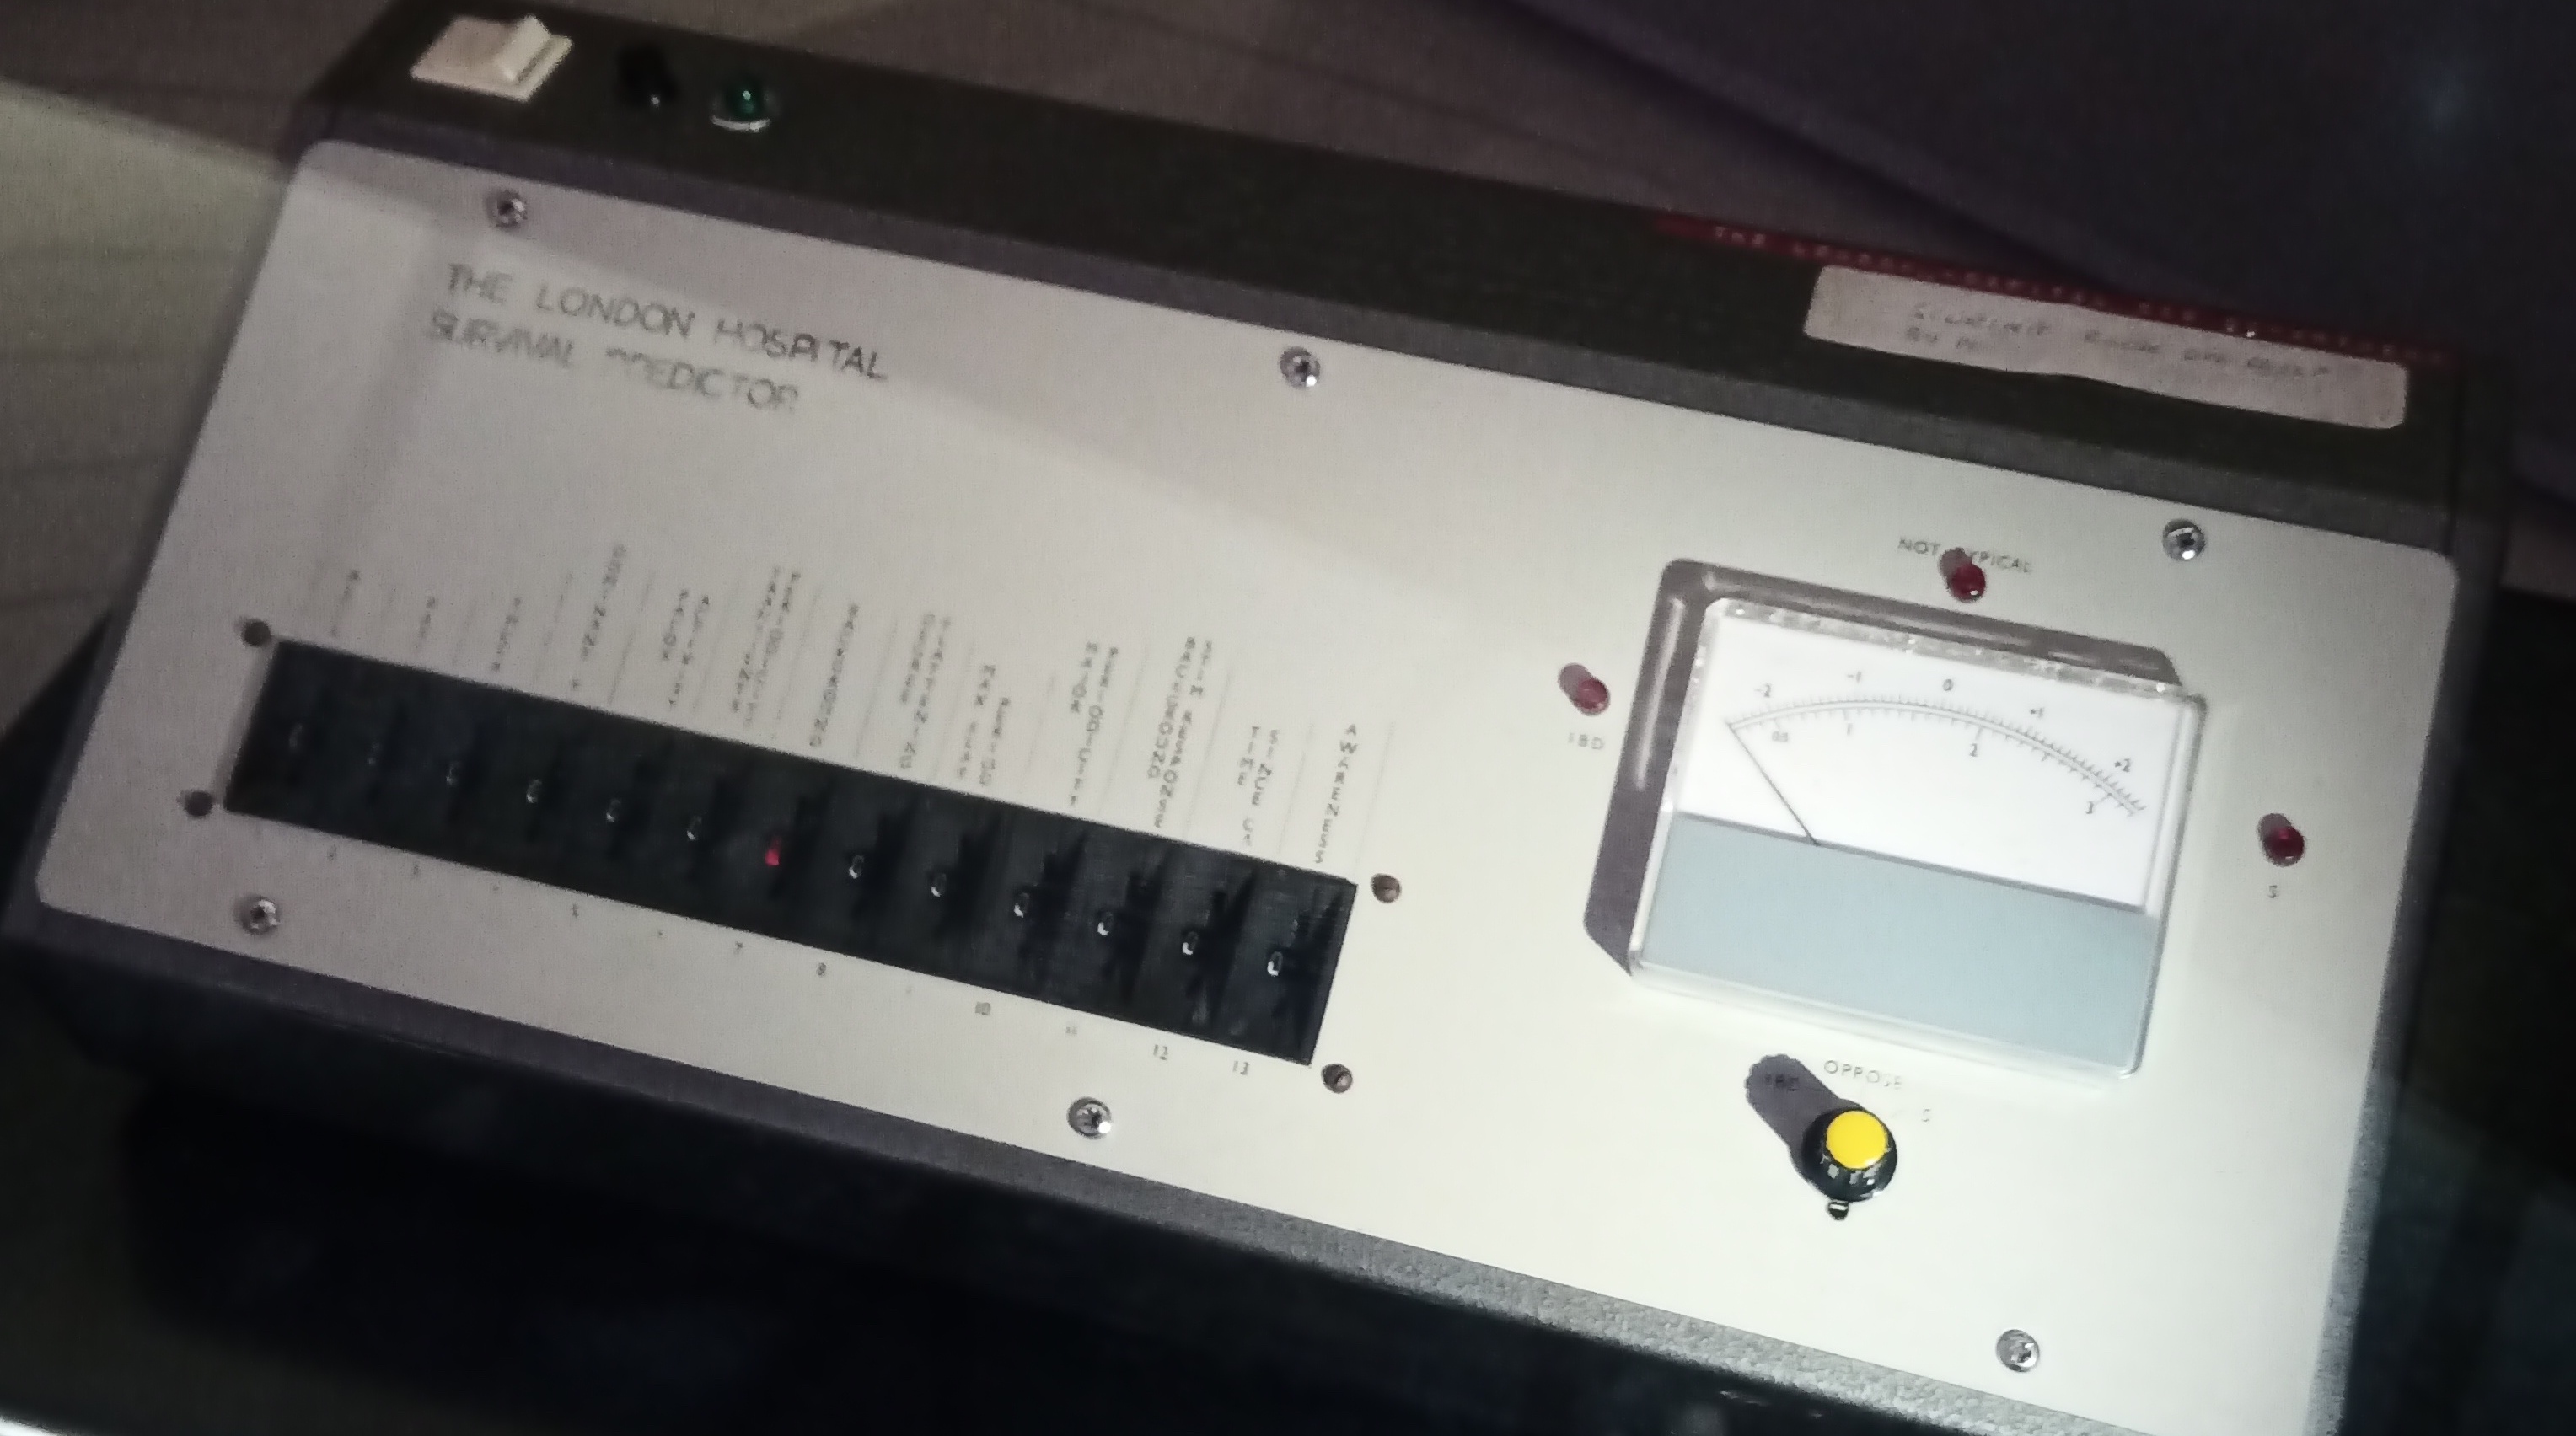
The London Hospital Survival Predictor (1972)
This machine by Douglas Maynard was one of the earliest uses of machine learning to predict survival. It used a early form of neural network to predict from EEG patterns whether patients would become either brain-dead or survive. It still required expert interpretation of the EEG patterns to input the relevant features, and learned from past data.
I also found it particularly interesting that there was a display on mathematical software, recognising both the importance that is plays in modern mathematical research, and also the fundamental change it made to the day to day focus of mathematicians.
The only other gallery I had time to visit (it is a huge museum!) told the story of the history of science in London. As well as the beautiful historical scientific instruments on display, it was fascinating to read about the motivations and attitudes of key figures of the time. For example the aim of one of the first scientific journals, the Transactions of the Royal Society was to record details of experiments so that they could be infinitely repeated, showing that reproducibility was at the heart of the foundations of science way back in 1665! And many of the most useful scientific instruments were manufactured to ensure that they were cheap and accessible to the masses, rather than being only accessible by the elite. However the museum also explained that Isaac Newton didn’t agree with these open science principles, and deliberately wrote his Principia Mathematica in complex pretentious language so that it would only be understood by the select elite.